The Accumulation/Distribution Line
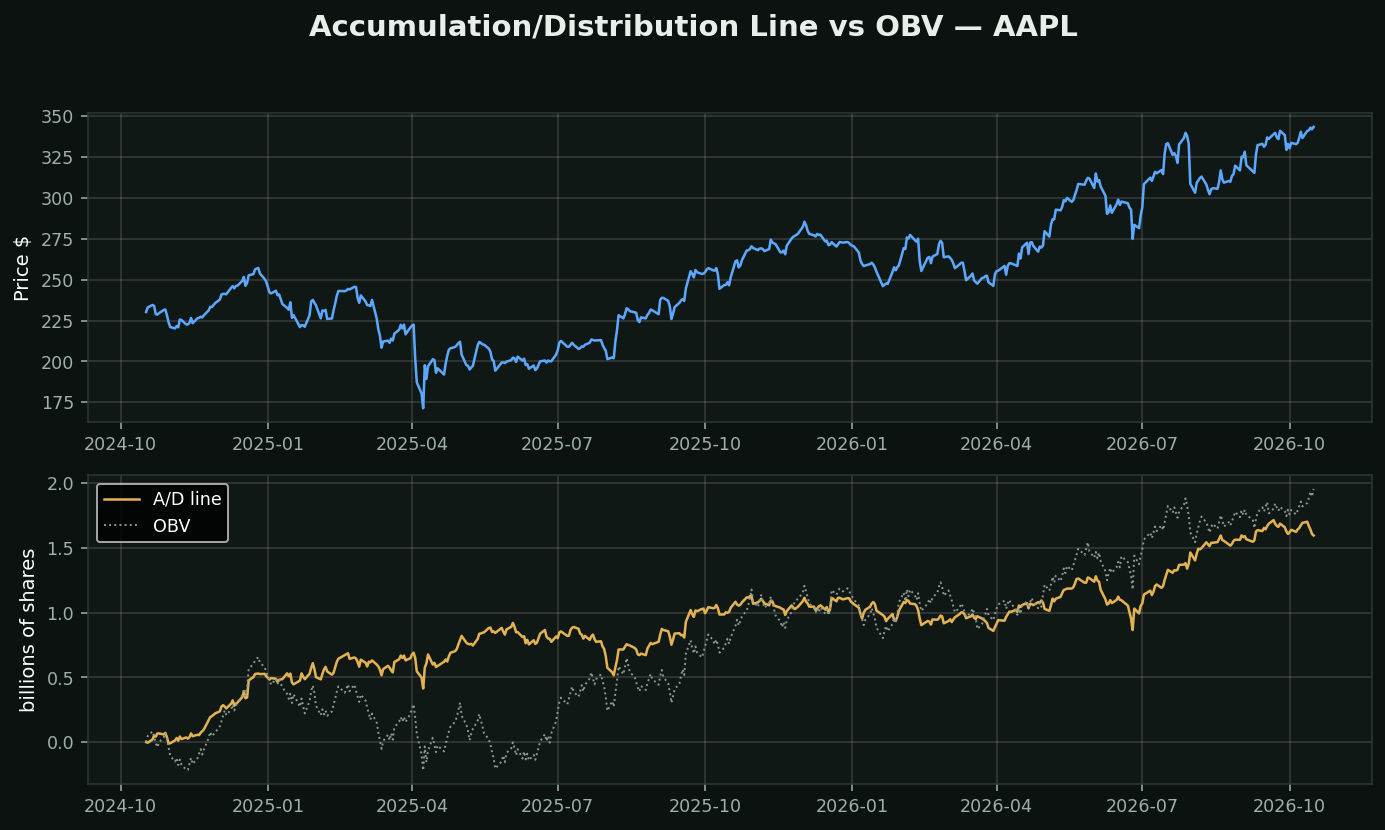
What it is: a running total. Each day, score where the close landed in the day's range (+1 at the high, -1 at the low), multiply by that day's volume, add to the total. Marc Chaikin.
How it differs from OBV — and this is the whole lesson. OBV adds the *entire* day's volume if the stock closed up a penny and subtracts *all* of it if it closed down a penny. A/D grades the day on a sliding scale. A stock that opens at the low, rallies all session and closes near the high but a cent below yesterday counts as a full negative day to OBV and a strongly positive one to A/D.
Which is right depends on what you think volume means. OBV says direction is binary and volume confirms it. A/D says the close's position in the range tells you who won, and volume scales it. On the chart the two lines separate exactly where those views differ.
The one flaw worth knowing: A/D ignores gaps entirely. It only looks inside the bar, so a stock that gaps down 8% and then closes at the top of its (much lower) range registers as accumulation. Twiggs Money Flow exists specifically to fix this.
How to use it: divergence against price, never the level. The absolute value depends on when you started counting.