The anchor test
You have now seen ten drawing tools. This is what to do with any of them.
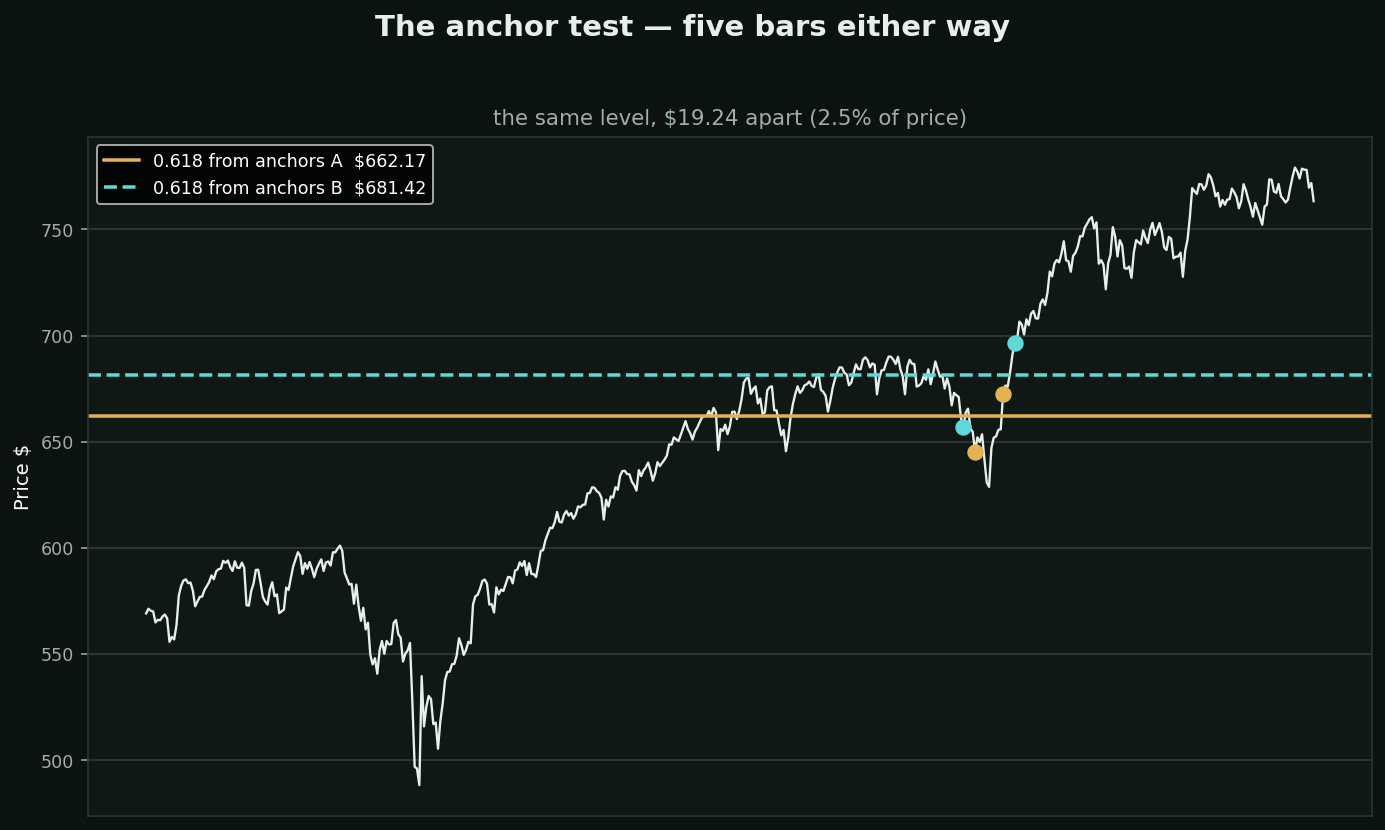
The test: draw it. Then move your anchor points by a few bars — an amount nobody would argue with — and draw it again. If the conclusion changes, you did not measure anything. You chose something.
On this chart the anchors moved five bars. The 0.618 level moved $19.24, which is 2.5% of the current price. Both anchorings are defensible. The level is not.
This is the dividing line for the whole palette:
• A study — RSI, MACD, ATR — takes price and returns a number. Two people get the same answer
• A drawing takes price AND points you chose. Two people almost never get the same answer
Which does not make drawings useless. They are for structuring a decision, marking a level you commit to in advance, and communicating with someone looking at the same chart. Those are real jobs.
What they cannot do is give you evidence. Nobody can quote you a hit rate for trendlines, because the trendlines in any study were chosen by someone who already knew what happened next.
So: decide the anchors before the move, write them down, and score them. That is the only version of this that can teach you anything.