Aroon
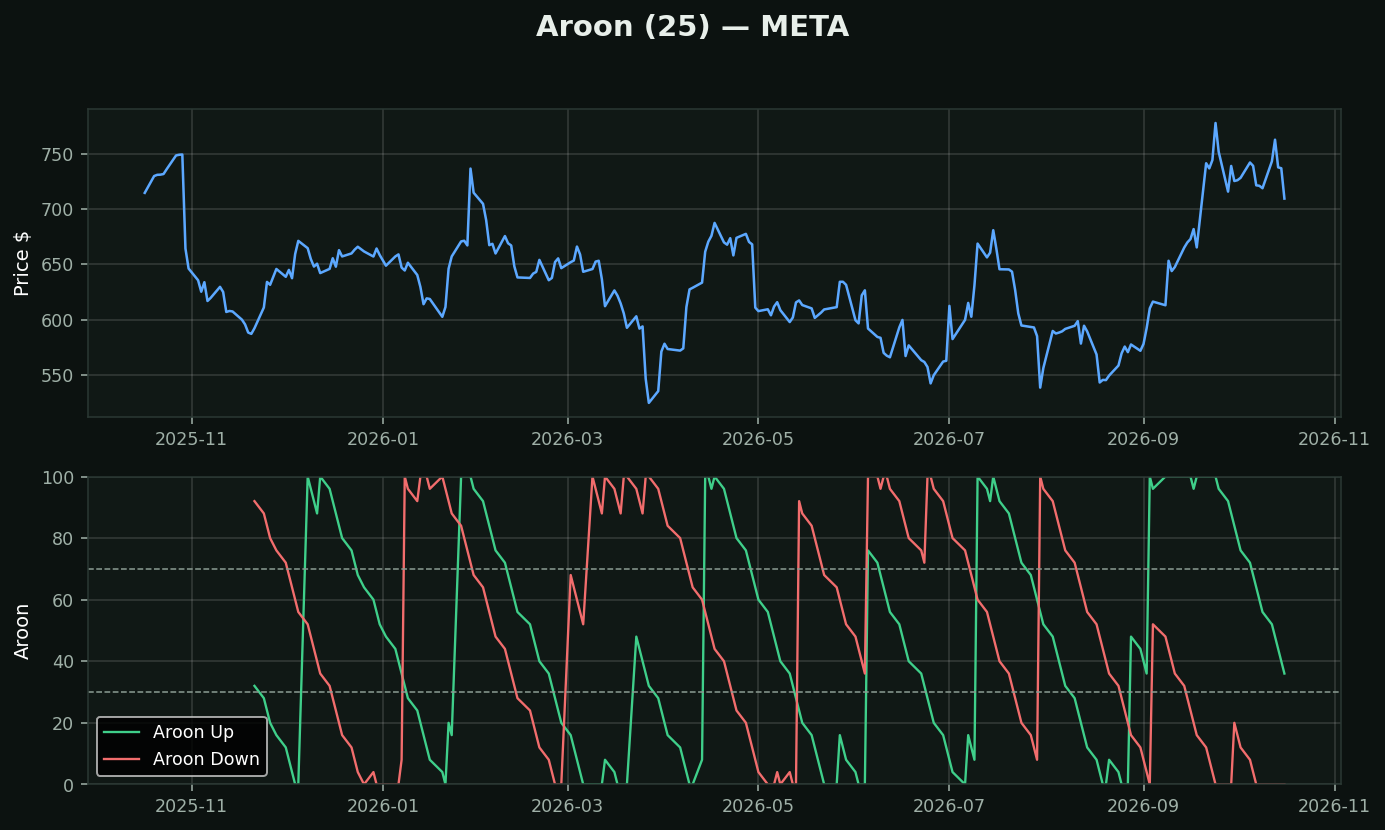
What it is: the only indicator here that measures TIME rather than price. Aroon Up asks *how many days since the 25-day high?* — 100 means today, 0 means 25 days ago. Aroon Down does the same for the low. *Aroon* is Sanskrit for the first light before dawn.
Why time is a different question: every other trend tool measures how FAR price has moved. Aroon measures how RECENTLY it made progress. A stock can be well above its moving averages purely on a move from six weeks ago — that reads as a healthy trend everywhere else and reads as a stalling one here.
How traders read it:
• Up above 70, Down below 30 → new highs are fresh; uptrend intact
• Both below 50 → no new extremes either way; the trend has gone to sleep and range tools apply
• The crossover is the classic signal and the weakest part
Aroon Oscillator is simply Up minus Down on one line from -100 to +100, which is easier to read and says the same thing.
What testing here found: this is a trend-following tool, and that family did not survive its own test. Over 413,946 stock-days, "price above its moving averages" preceded -0.46% at 21 days (t=-4.40) while downtrend preceded +1.14% (t=+6.02). Use it to describe a trend and to manage a stop — not to decide direction.