Awesome Oscillator
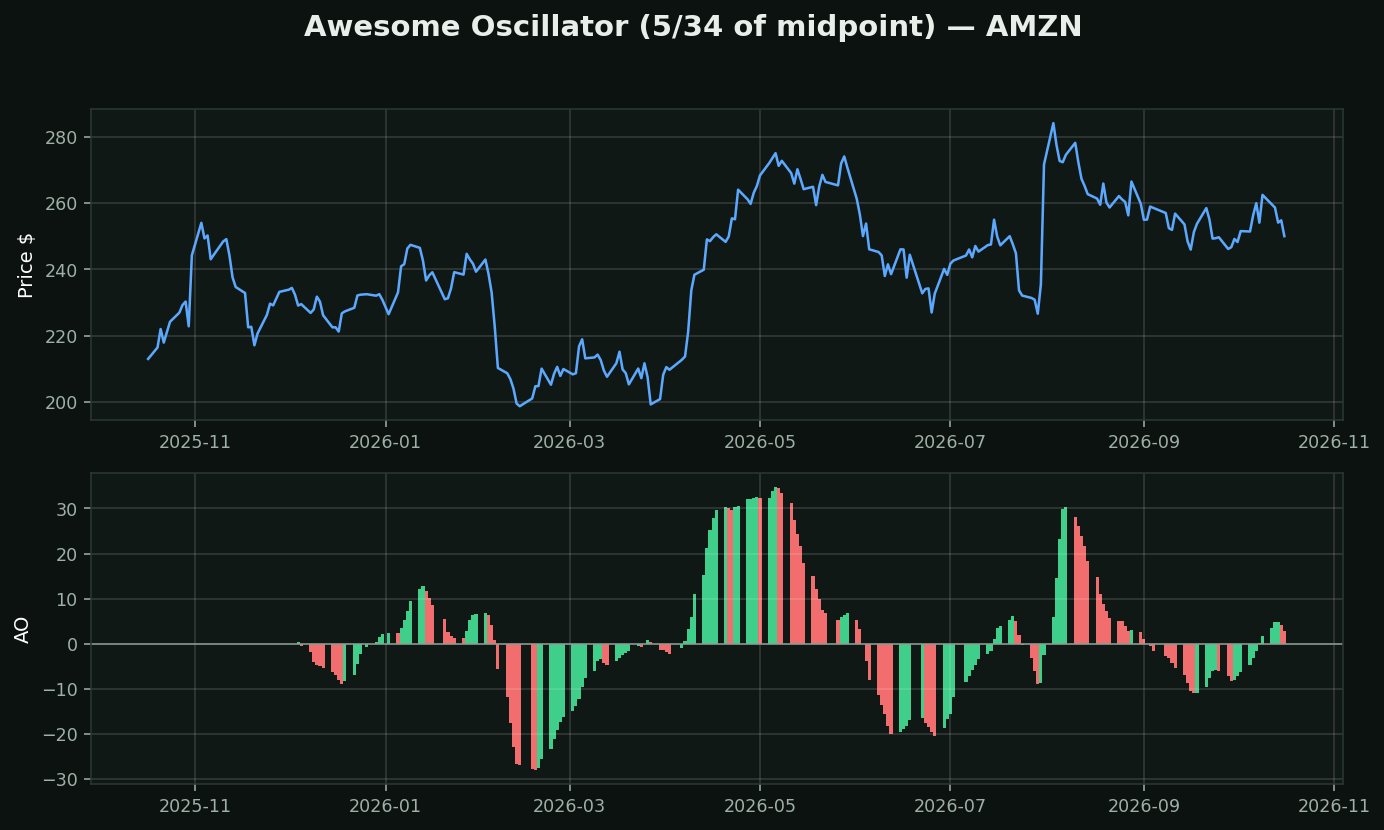
What it is: the 5-period average of the bar's MIDPOINT minus the 34-period average of the same. Bill Williams. Plotted as a histogram coloured by whether it rose or fell versus the previous bar.
The one real difference from MACD: it uses (high+low)/2, not the close. Williams' argument was that the close is the most manipulated and most news-distorted price of the day — the last-minute order, the index rebalance, the after-hours setup. The midpoint of the day's range is where the market spent its time. Whether you buy that is a judgment call, but it is a real argument, not decoration.
Note the two colours mean something specific: green means AO is higher than the previous bar, red means lower. So the colour is the SECOND derivative — the rate of change of momentum. A red bar above zero means still bullish, but decelerating.
How traders use it:
• Zero cross — the 5 and 34 averages changing places
• Twin peaks — two peaks below zero with the second shallower, the classic setup
• Saucer — three bars, colour change then change back
Family: MACD with different periods and a different input.
What testing here found: this is a trend-following tool, and that family did not survive its own test. Over 413,946 stock-days, "price above its moving averages" preceded -0.46% at 21 days (t=-4.40) while downtrend preceded +1.14% (t=+6.02). Use it to describe a trend and to manage a stop — not to decide direction.