Bollinger Bands
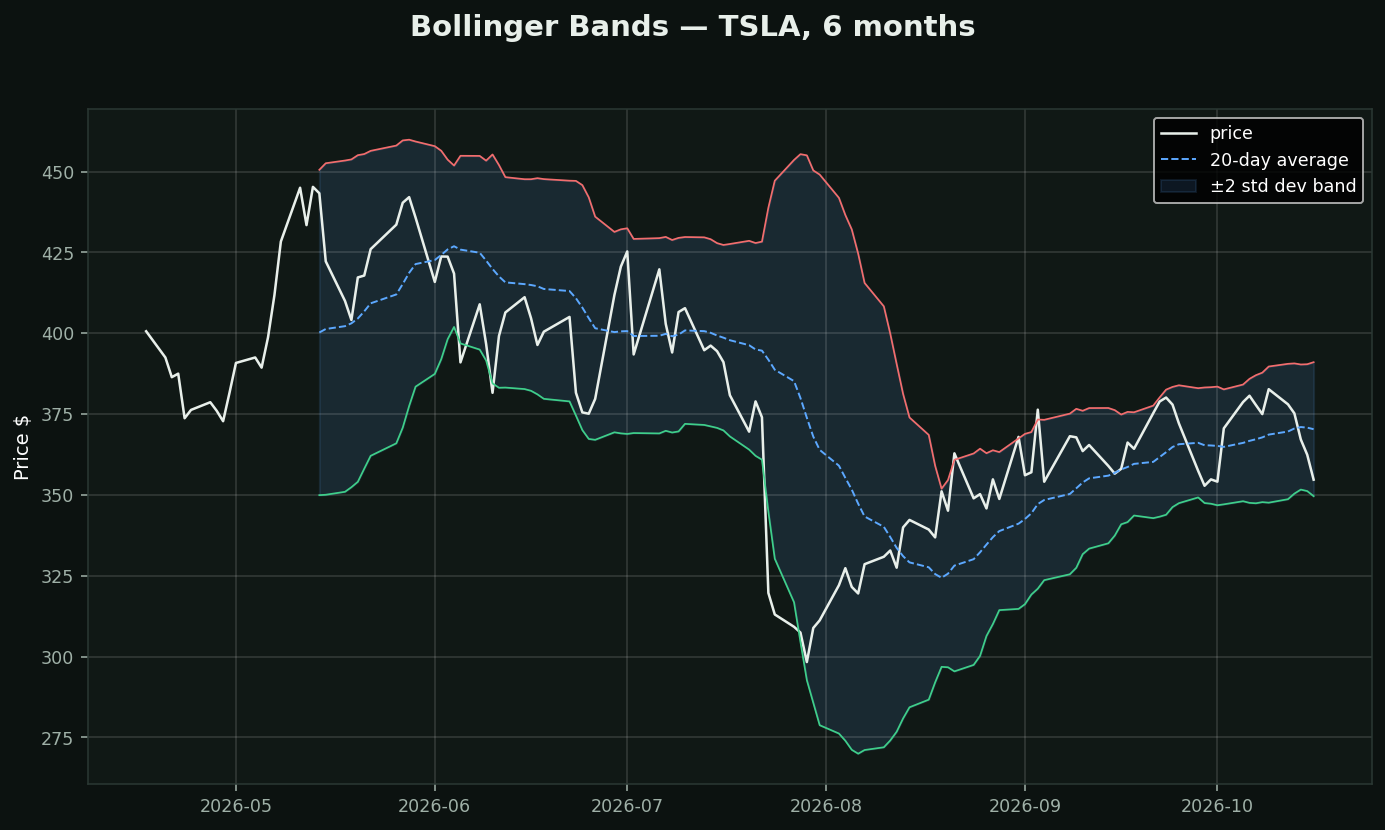
What they are: a rubber-band around price — the 20-day average plus/minus 2 standard deviations. The band expands when the stock is wild and squeezes when it's calm.
How to read them:
• Price touching the lower band = statistically stretched down (bounce candidate)
• Touching the upper band = stretched up
• The SQUEEZE — bands pinch tight = energy building; big moves are born from tight bands
How traders use them: mean reversion in ranges, breakout hunting after squeezes. In strong trends price can "walk the band" — touching the upper band repeatedly — so band touches alone are not signals.
Chart: TSLA with its bands — note how touches resolve.