Commodity Channel Index
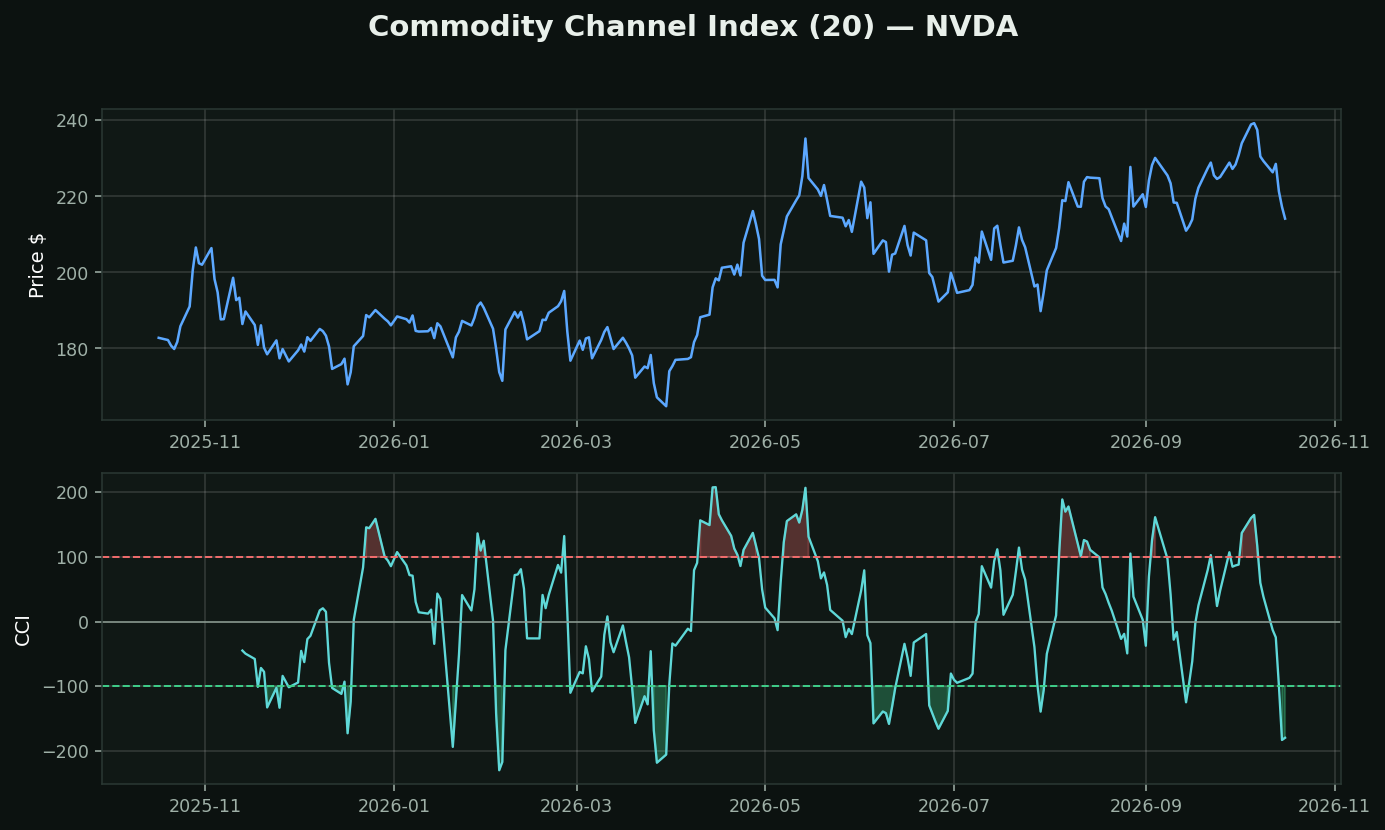
What it is: how far the typical price (high+low+close over 3) has strayed from its 20-day average, measured in units of its own average deviation. Donald Lambert, 1980 — built for commodities, now used on everything.
The 0.015 mystery: that constant exists purely so the output lands between -100 and +100 about 70–80% of the time. It is a cosmetic scaling choice, not a discovery, and it is why CCI is unbounded — unlike RSI or Stochastic, it can print +400 and there is no ceiling to tell you that is unusual.
What it is really doing: it is a z-score with the standard deviation swapped for mean absolute deviation. Which means it belongs to the same family as Bollinger Bands and %b — one idea, three products.
How traders use it:
• Above +100 / below -100 → stretched, the classic fade
• The zero line is the 20-day average — crossings are a trend read, and that read is the weak half of this indicator
• Unbounded is genuinely useful for spotting a move that has no precedent in recent history
What testing here found: the contrarian read on this family holds up. Across 413,946 stock-days, RSI-oversold names beat the base rate by +0.82% over the next 21 days (t=+4.09) and overbought names trailed by -0.58% (t=-4.27). Oscillators that measure stretch survived their test here; the trend-followers did not.