Choppiness Index
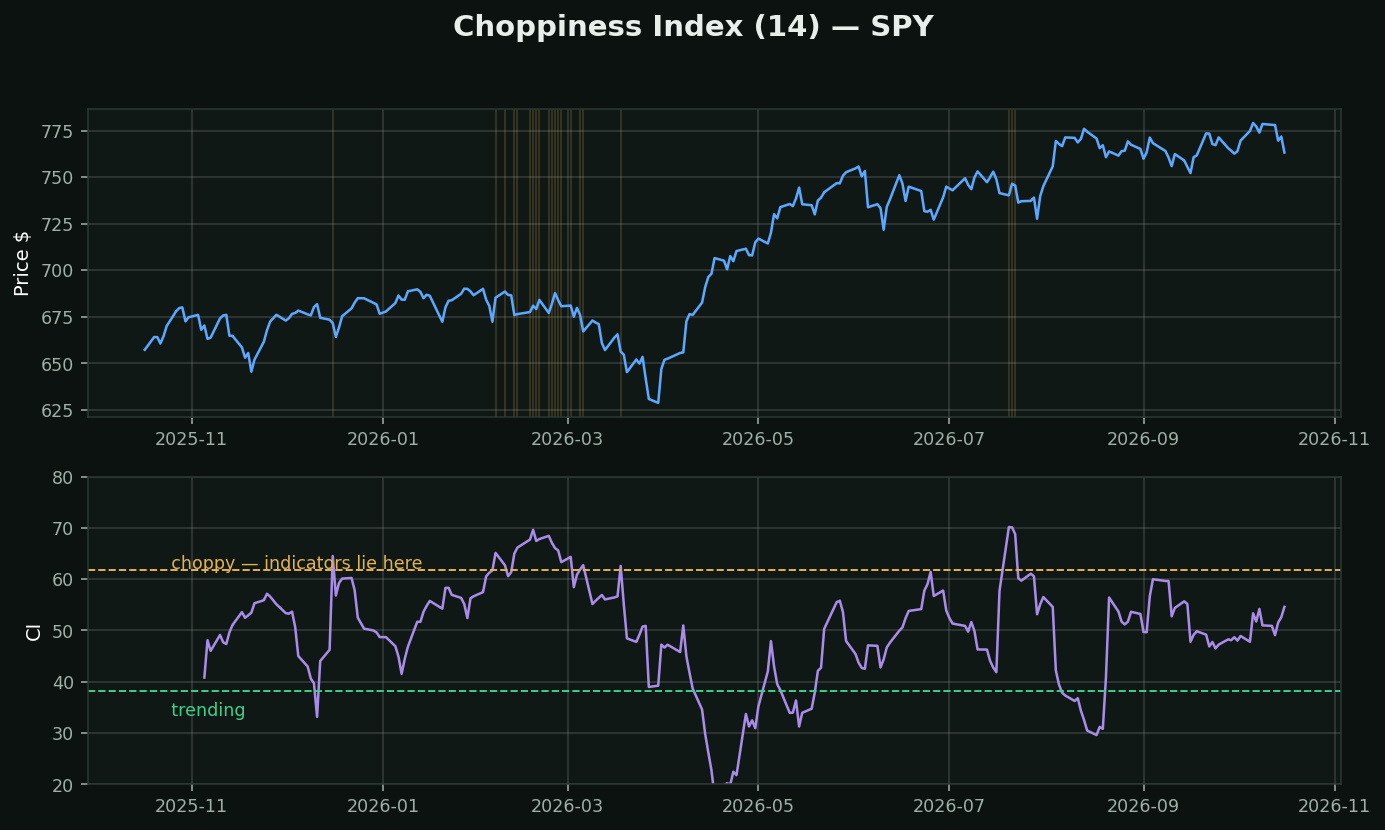
What it is: it compares the total ground price covered over 14 days against the net distance from the 14-day high to low. If price travelled a long way but ended where it started, the market is chopping. If it travelled roughly the direct distance, it is trending.
Why this is the meta-indicator: every other study on the list assumes a regime. Trend-followers are shredded in chop. Oscillators are shredded in trends. Choppiness does not tell you which way to trade — it tells you which of your other indicators to ignore today, and that is the more valuable answer.
How traders use it:
• CI above 61.8 → chop. Moving-average crosses will whipsaw. Fade the range, sell premium, or sit out
• CI below 38.2 → a real trend. Oscillators will read "overbought" for weeks and be wrong every day
• It is non-directional by construction — high chop precedes breakouts in either direction
A note: the 61.8/38.2 lines are Fibonacci numbers, which is decoration, not mathematics. The thresholds work because they are roughly the right percentiles, not because of the golden ratio.