The Coppock Curve
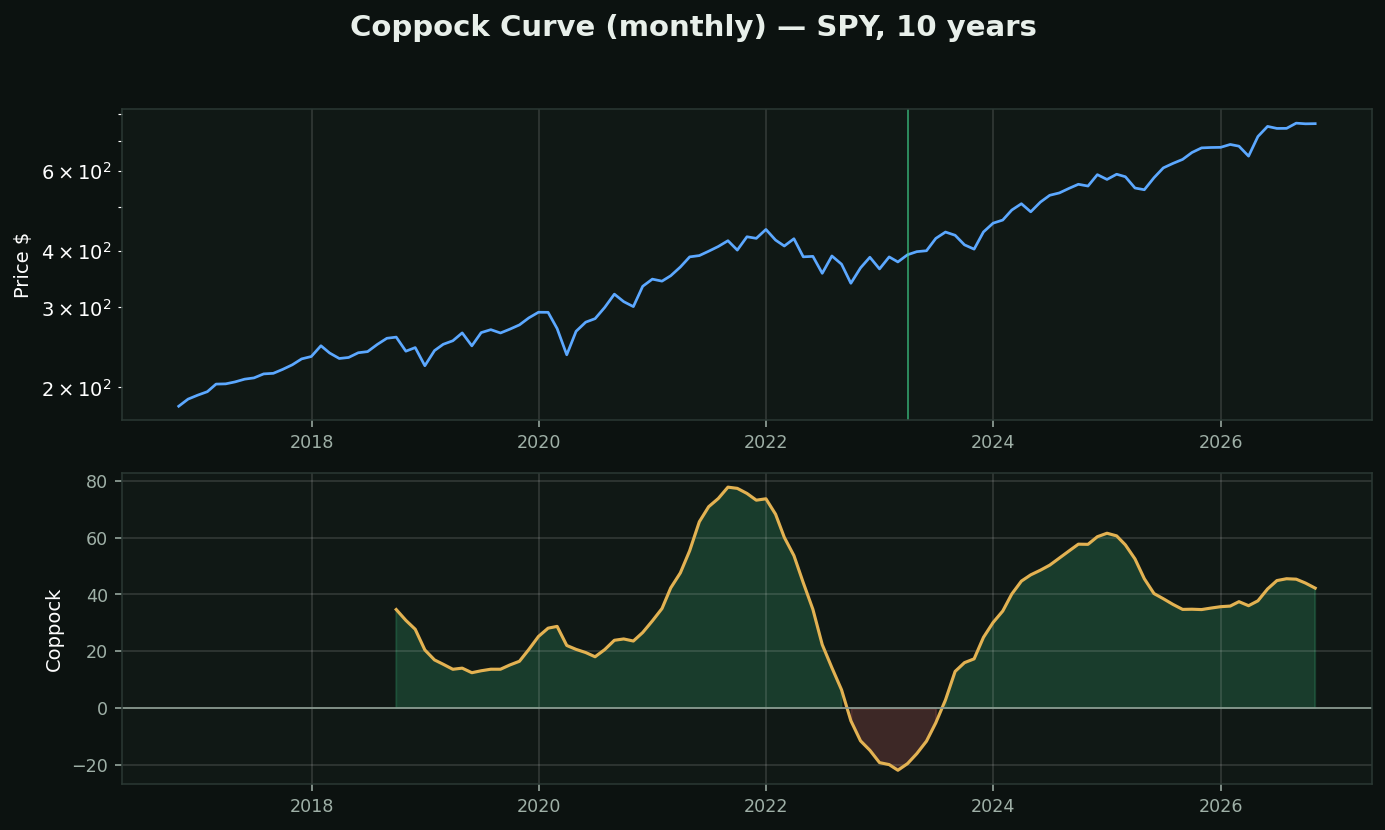
What it is: a weighted average of two long rate-of-change readings, on MONTHLY data. Edwin Coppock published it in Barron's in 1962. It fires perhaps once every few years.
Where the numbers came from, which is the best story in technical analysis: Coppock was asked by an Episcopal church to find long-term buying points. He asked the bishops how long people typically grieve after a bereavement. They said 11 to 14 months. He used 11 and 14 as his lookbacks, on the theory that a bear market is a period of mourning and recovery takes about as long.
That is not a joke and it is not rigorous. It is an arbitrary parameter choice with a memorable justification — and it is worth knowing precisely BECAUSE the indicator is still widely followed sixty years later. Most indicator parameters have an origin no better than this; they just lack the anecdote.
The single rule: when Coppock turns UP from below zero, that is a long-term buy. Green lines on the chart mark them. There is no sell signal — Coppock never defined one.
How to use it: as an asset-allocation timer on indexes, never on single stocks, and never for anything under a year.