Dividend yield
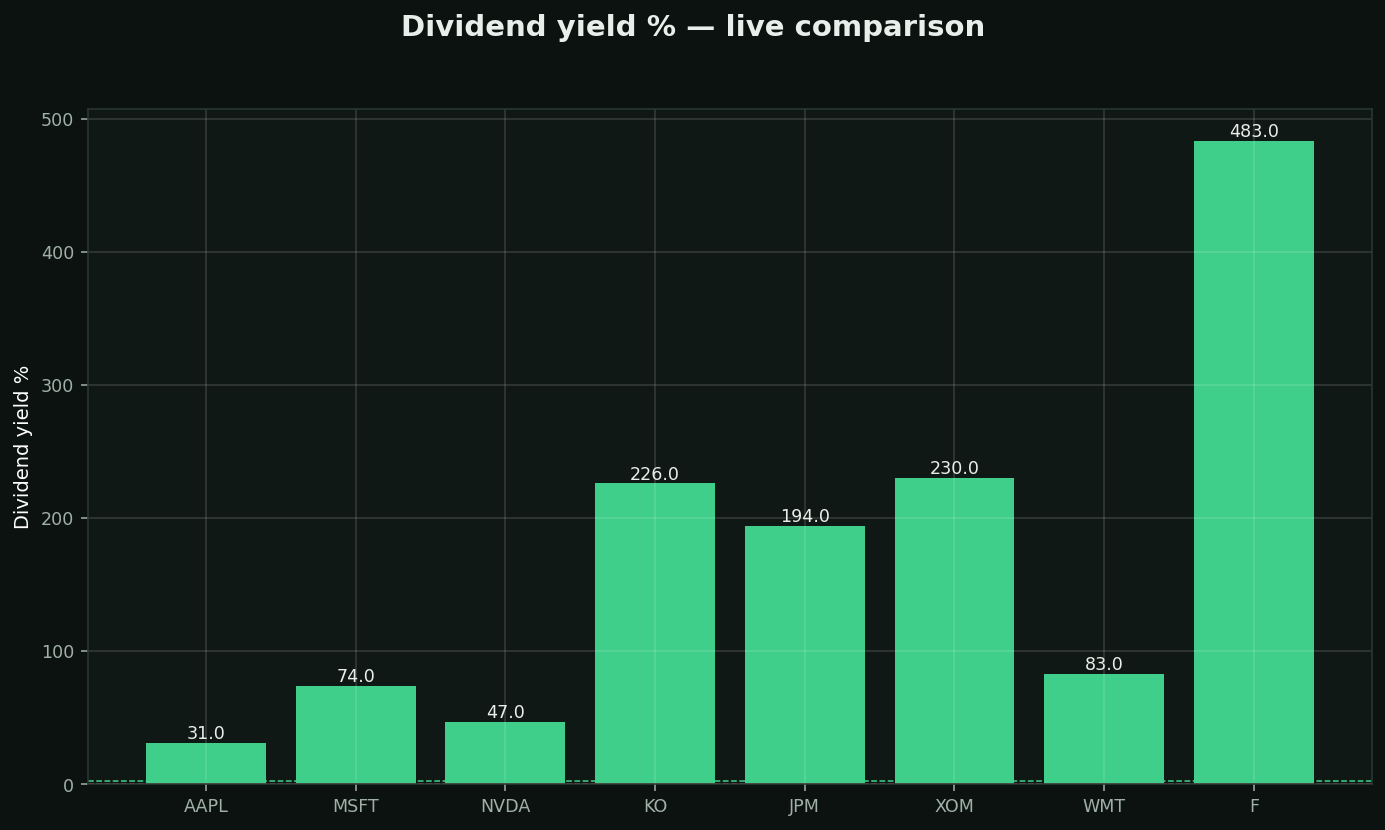
What it is: the yearly cash payout as a % of the stock price — the part of your return nobody can take back.
Rules of thumb:
• 2-4% from a company that RAISES it yearly = the sweet spot
• A yield way above peers (8%+) is usually a WARNING, not a gift — the price crashed because the market expects the dividend to be cut
• Zero yield is fine for growers — reinvesting beats paying out
The number that matters more: payout ratio — dividends ÷ profits. Under 60% = sustainable and raisable. Over 90% = one bad year from a cut.
Chart: live yields — KO/XOM the payers, NVDA the reinvestor.