Elliott Wave
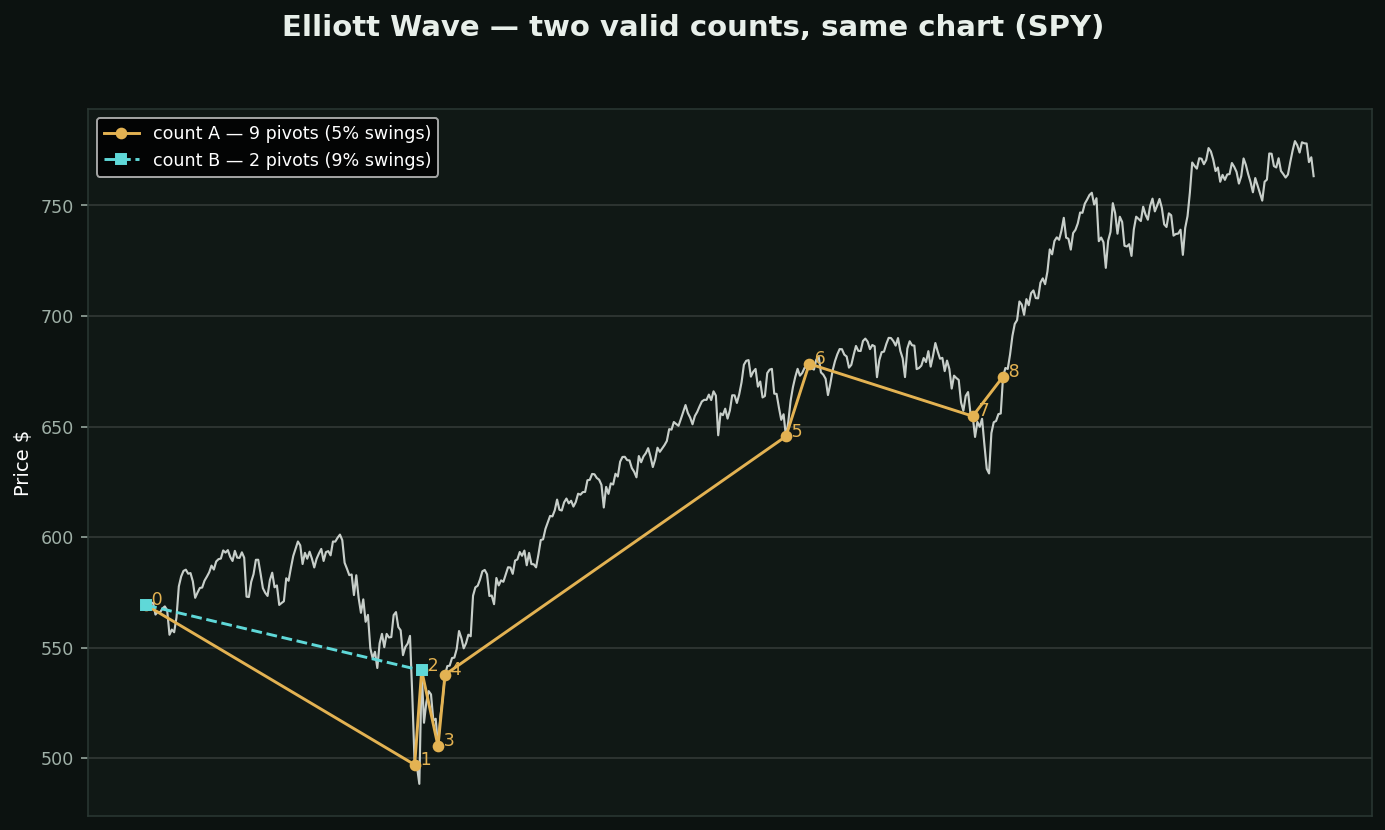
What it claims: markets move in five waves with the trend and three against it, and those waves repeat at every scale — the same shape in a minute chart and a decade chart. Ralph Elliott, 1930s.
The appeal is real. Markets genuinely are fractal-ish, sentiment genuinely does cycle, and a framework that says where you are in a move is exactly what a trader wants.
The chart is the problem. Both lines are the same price data. The amber count finds 9 swings; the cyan count finds 2. Neither is wrong — they use different thresholds for what counts as a wave, and the theory does not specify one.
So the count is chosen, not found. And when a count is violated, the method's own rules permit a recount: what looked like wave 3 becomes wave 1 of a larger degree. A framework that can absorb any outcome by relabelling cannot be wrong, and anything that cannot be wrong cannot be evidence.
What to keep: the underlying observation that trends move in impulses and pullbacks is sound and useful. The numbered certainty on top of it is not. If you use it, write the count down in advance and score it — that is the only version that can teach you anything.