Elder's Force Index
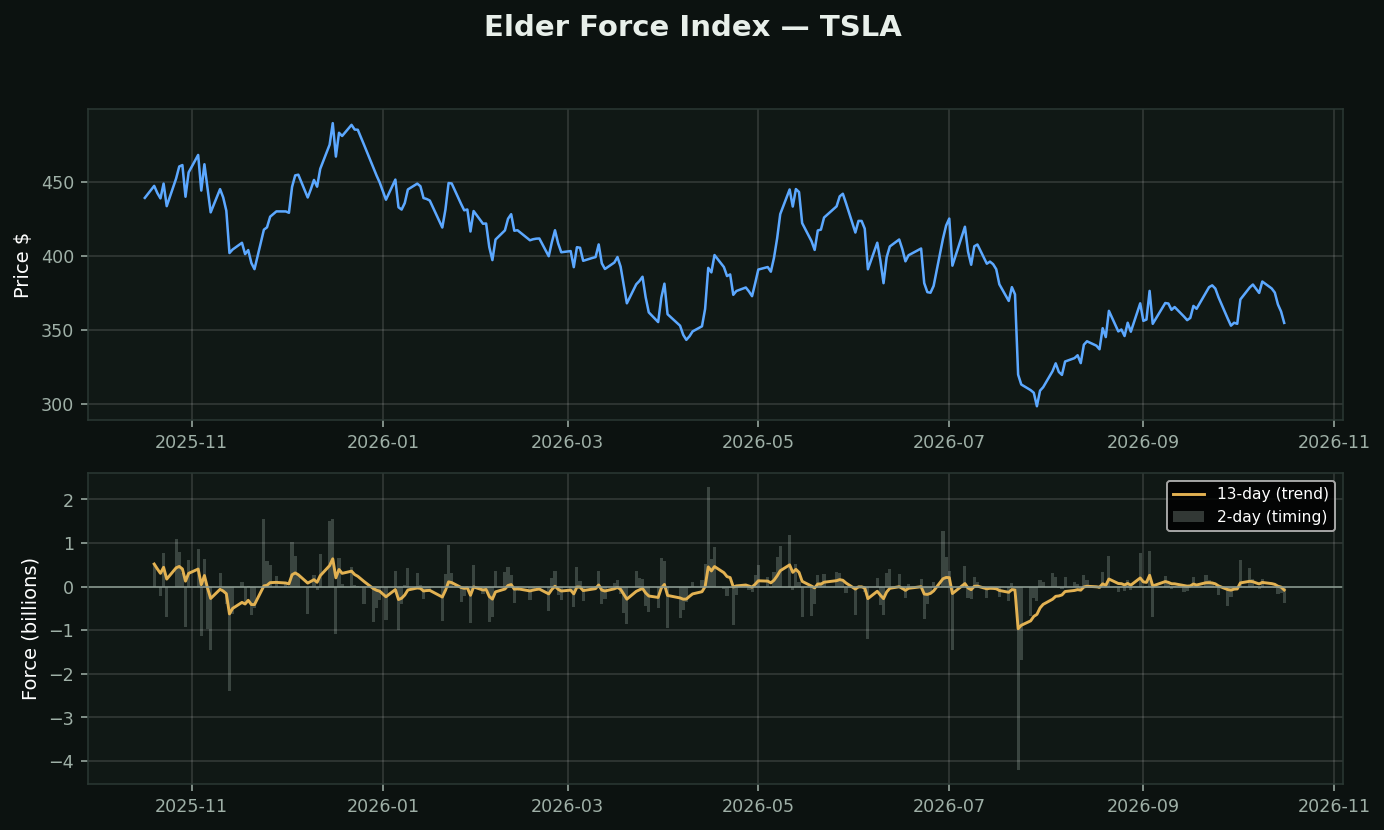
What it is: price change times volume. Alexander Elder. Deliberately the simplest formula in this category — and it combines the three things Elder argued matter: direction (sign), extent (size of the move), power (volume behind it).
The unusual part is that it is used at two speeds. Elder ran two versions on purpose:
• 13-day (amber) — the trend read. Above zero means bulls have been in control; a new high in Force with a new high in price is confirmation
• 2-day (grey bars) — the timing read, and the one he actually traded. In an uptrend, a 2-day Force Index dipping NEGATIVE is a pullback inside a healthy trend: a place to buy, not a warning
Why that split is the lesson: the same indicator at two lookbacks answers two different questions, and traders routinely use one setting to answer both. Most of the study library has this problem; Elder is one of the few authors who made it explicit.
How traders use it:
• 13-day above zero + 2-day negative = the classic entry
• A spike to a new Force extreme after a long move often marks exhaustion, not continuation
• Divergence, as always, is the highest-quality read