Gartley and the harmonic patterns
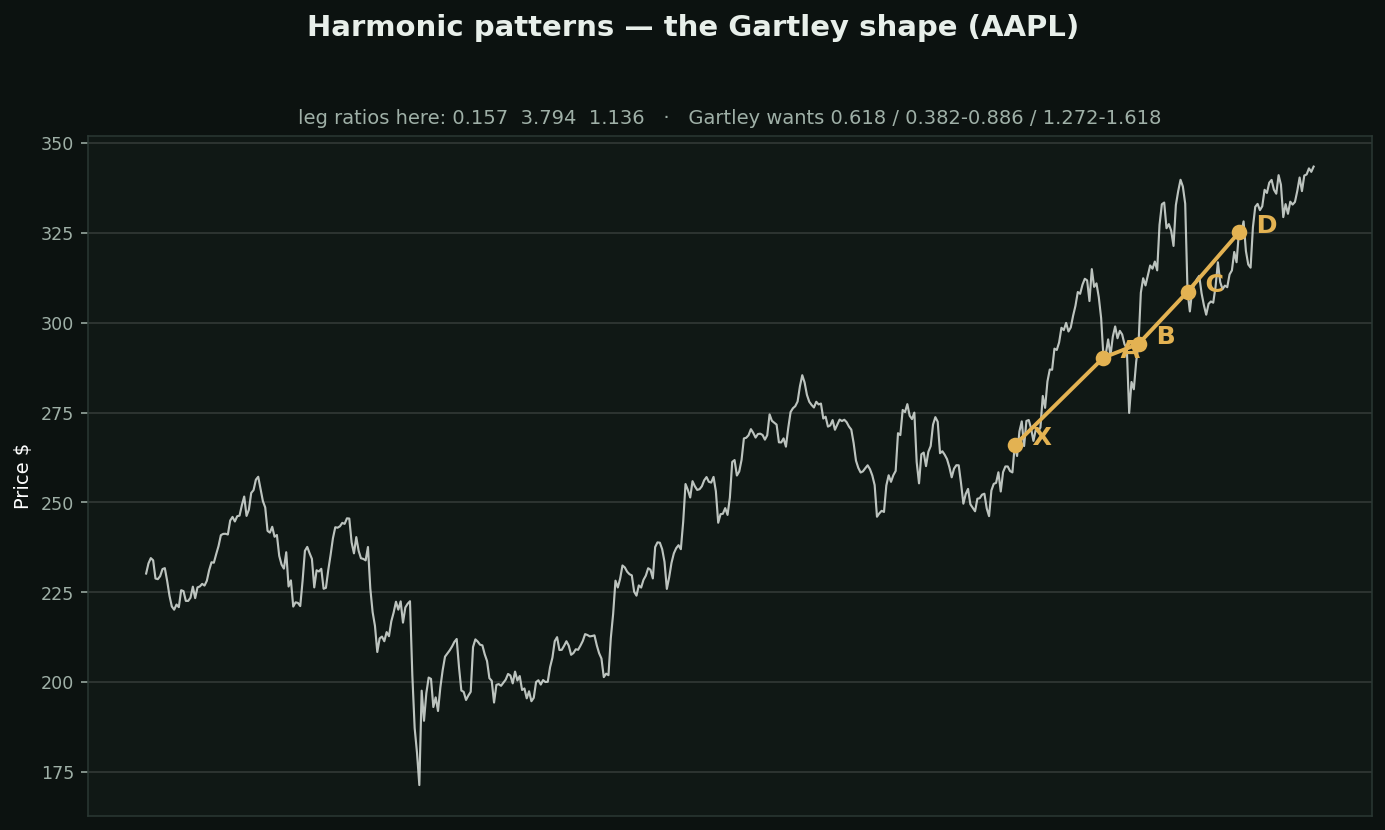
What they are: five-point shapes — X, A, B, C, D — where each leg must be a specific Fibonacci ratio of the previous one. The Gartley wants B at 0.618 of XA and D at 0.786. Its relatives — Bat, Butterfly, Crab, Shark — are the same idea with different required ratios.
What is genuinely good about them: unlike a trendline, a harmonic pattern has a DEFINITION. The ratios are specified, so two people scanning the same data should find the same patterns. That makes them testable in principle, which puts them ahead of most of this palette.
What spoils it in practice — the tolerance. The ratios never land exactly, so every implementation allows a window: 0.618 becomes 0.60 to 0.64, or 0.55 to 0.68 if you are relaxed. Widen the tolerance and patterns appear everywhere; tighten it and they vanish. The tolerance is the real parameter, and nobody publishes theirs.
And the patterns complete in hindsight. Point D is only confirmed once price has arrived there, which is also the moment the trade is supposed to start.
If you trade them: fix your tolerance in writing before you look, and log every pattern you find — including the ones that failed. That is the difference between a method and a scrapbook.