Gross margin
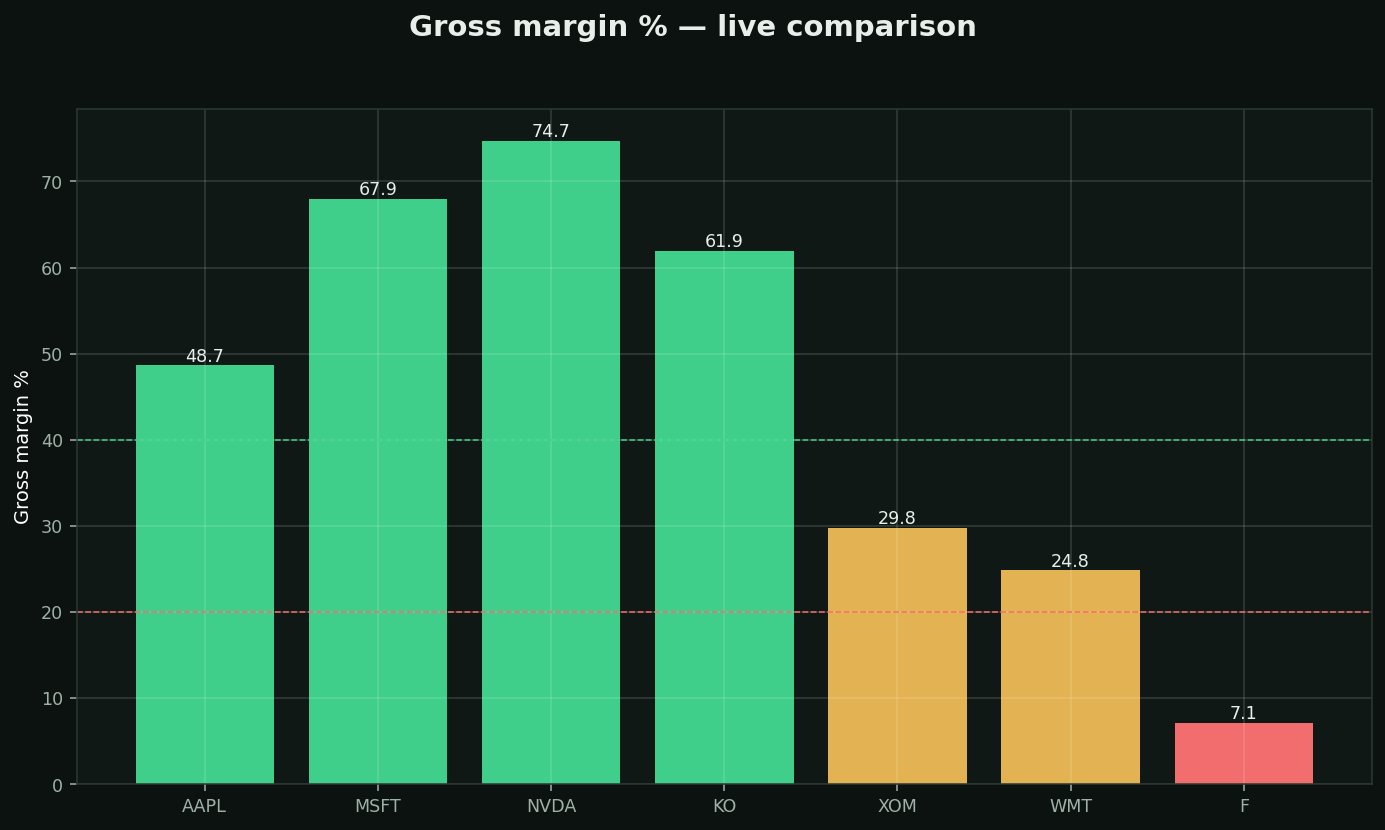
What it is: what's left of each sales dollar after ONLY the direct cost of the product. The purest read on pricing power — before accountants get creative.
Rules of thumb:
• 70%+ = software/luxury — selling something almost free to reproduce
• 40%+ (green) = strong brand or moat · under 20% (red) = commodity — competing on price alone
The signal inside the signal: DIRECTION. A company that raises gross margin year after year is winning pricing power; erosion means competitors are underpricing them. Gross margin cracks show up 2-3 quarters before profit warnings — it's the earliest fundamental tell there is.