Guppy Multiple Moving Average
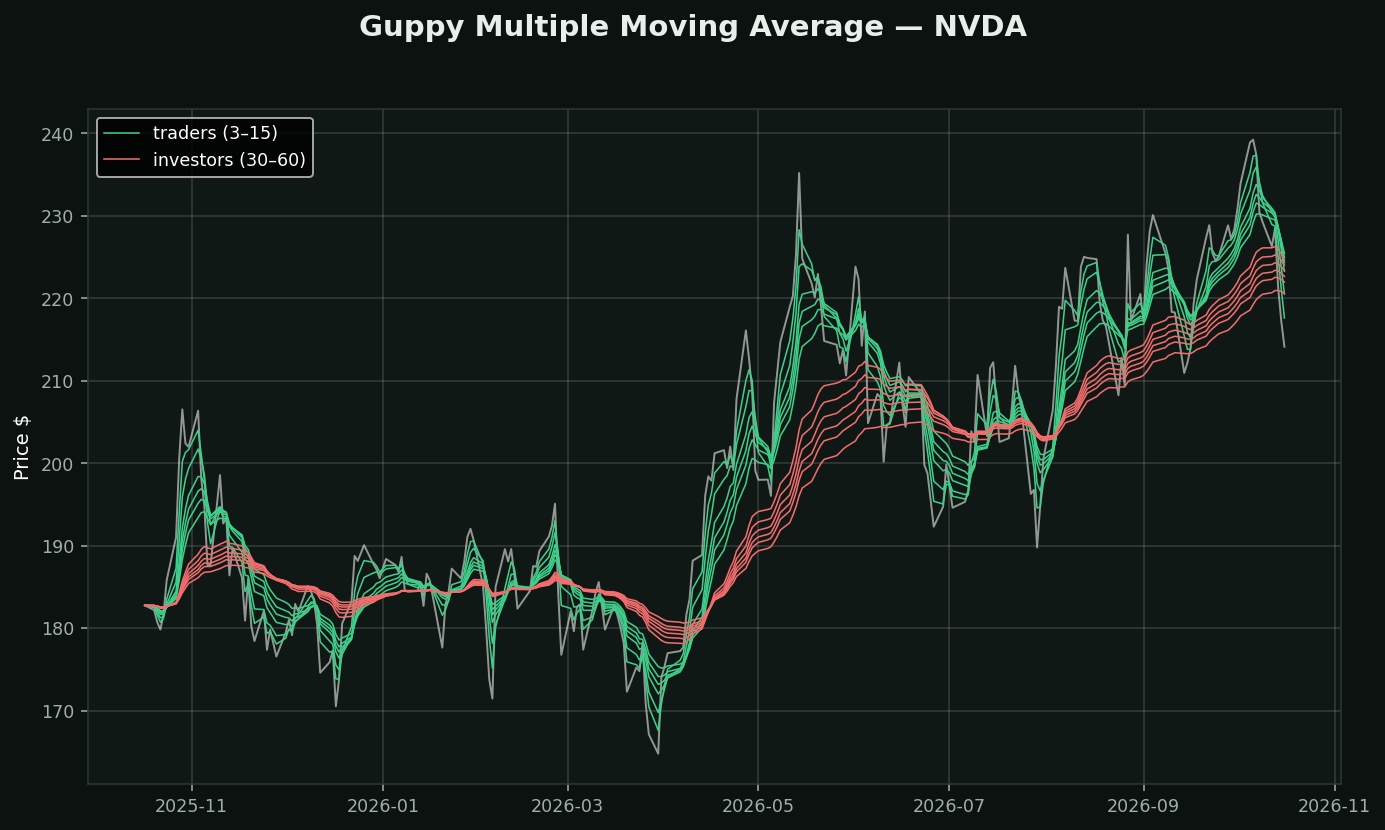
What it is: twelve exponential averages in two groups. Six short (3 to 15 days) in green, six long (30 to 60) in red. Daryl Guppy.
The idea, and it is a genuinely good one: the short group is the traders — fast money, in and out on news. The long group is the investors — slow money, position sizes that take weeks to build. Every chart has both, and they behave differently. Guppy's insight was to stop averaging them together into one line and look at each group's agreement instead.
What to read:
• Short group compressed → traders agree on value. Usually right before they all act at once
• Short group fanned wide → disagreement, and that is where moves come from
• Long group steady while the short group whipsaws → investors are unmoved. Pullback, not a reversal — the strongest read here
• Both groups compress and cross → real change of ownership
The honest caveat: twelve averages of the same closing price are not twelve opinions. They are one series smoothed twelve ways, and they correlate near 1. The chart can look like overwhelming confirmation when it is showing you one fact repeatedly. What Guppy actually adds is *dispersion within a group* — read the spacing, never the count of lines pointing up.
What testing here found: this is a trend-following tool, and that family did not survive its own test. Over 413,946 stock-days, "price above its moving averages" preceded -0.46% at 21 days (t=-4.40) while downtrend preceded +1.14% (t=+6.02). Use it to describe a trend and to manage a stop — not to decide direction.