Indicator overload
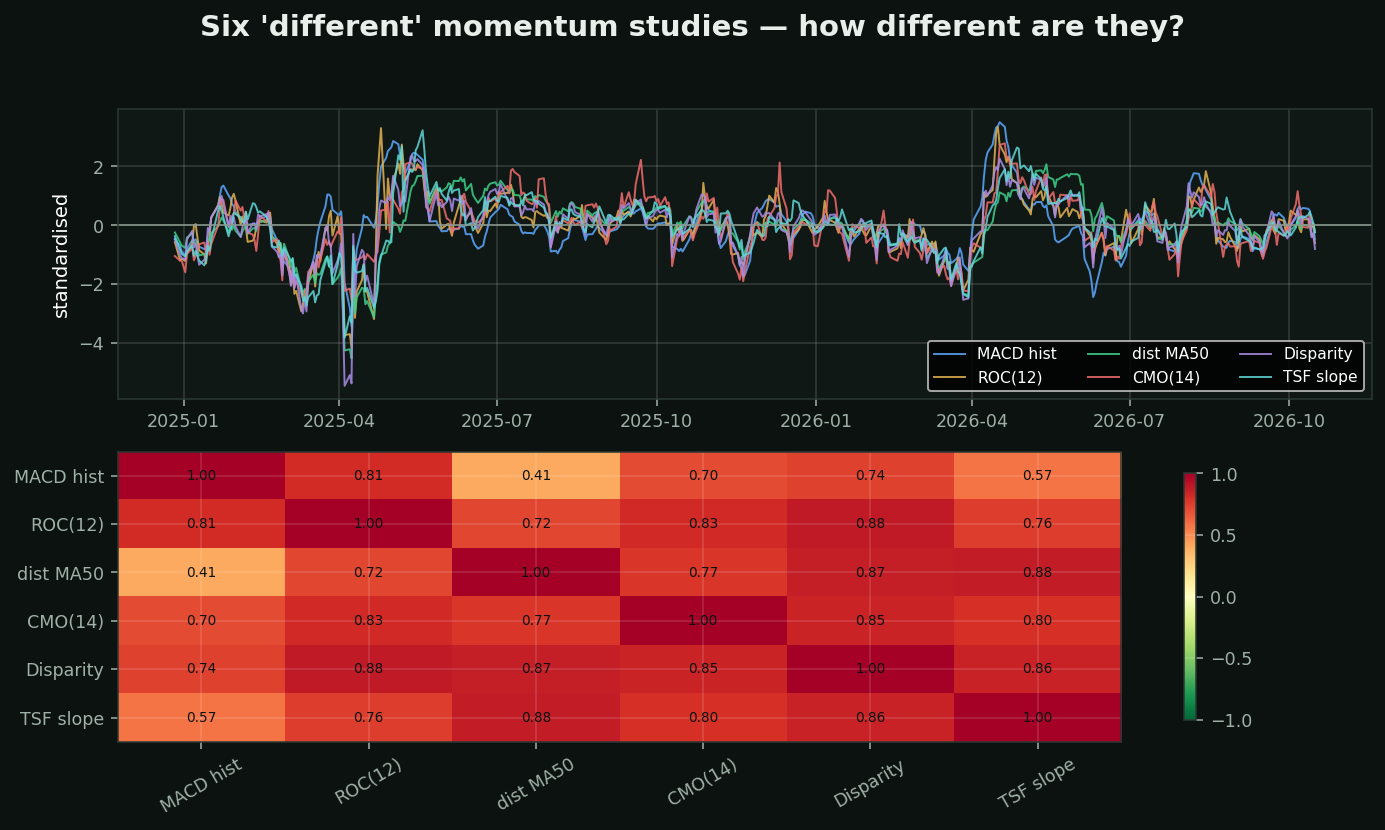
The setup: a broker's study library has roughly 120 entries. The top of the chart shows six from the momentum category — MACD histogram, Rate of Change, distance from the 50-day, Chande Momentum, Disparity Index, and time-series slope — all standardised onto one scale.
They are the same line. Average pairwise correlation: 0.76. Six studies, six sets of parameters, six different inventors, one opinion. Stacking them does not confirm anything; it just renders the same number six times and makes it feel like evidence.
The deeper trap — multiple testing. Try 20 indicators on the same stock and one will look brilliant by chance alone. That is not a discovery, it is arithmetic. Serious testing raises the bar for how strong a result must be as you add tests; a chart with 8 studies on it has no such control.
What this toolkit did about it: every signal here was measured over 413,946 stock-days. Most of the trend family failed — "price above its moving averages" preceded -0.46% at 21 days (t=-4.40). Those engines had their trend legs inverted as a result.
The practical rule: pick ONE per job. One trend, one oscillator, one volatility, one volume. Four studies that disagree are worth more than eight that agree.