Keltner Channel
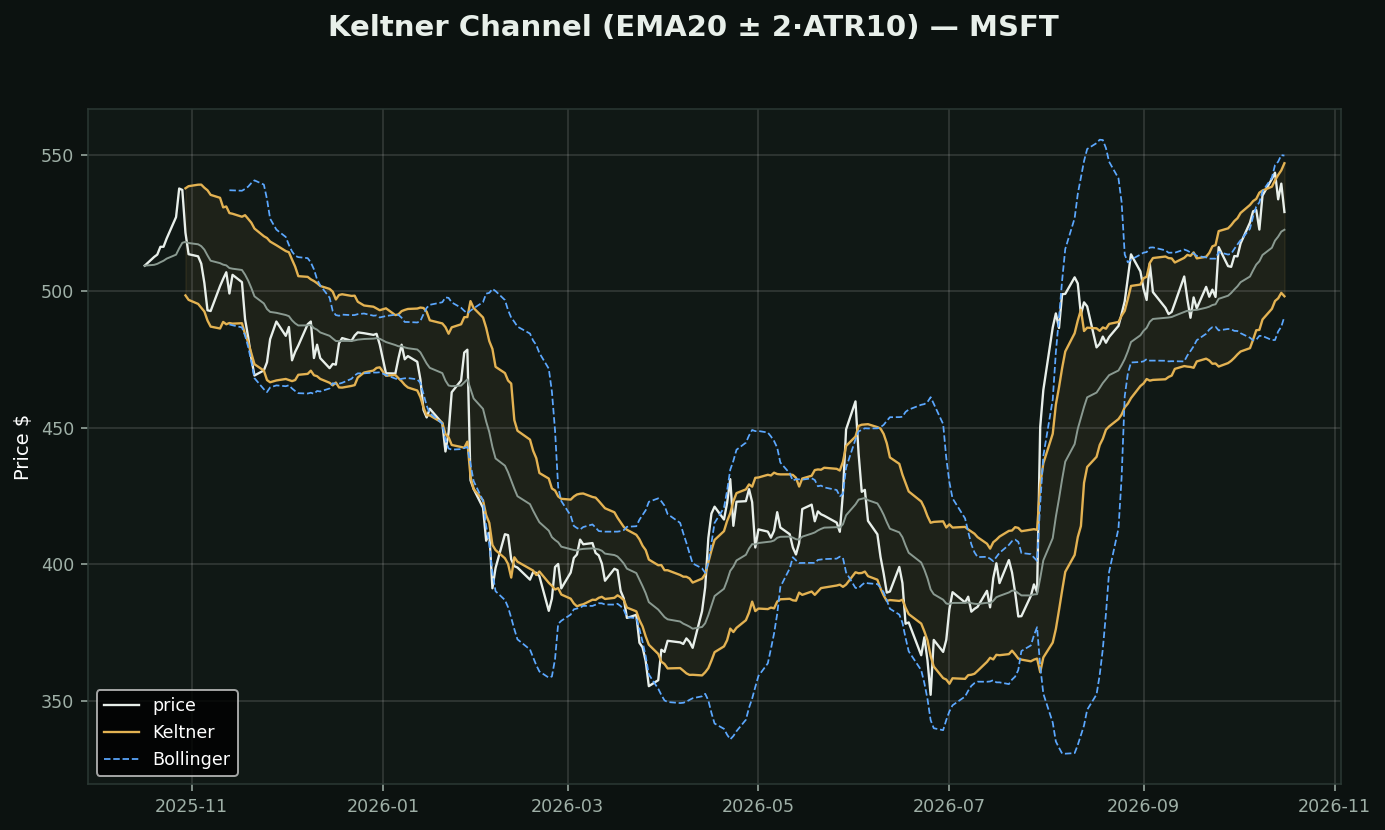
What it is: a moving average with bands set at a multiple of ATR — average true RANGE — above and below.
How it differs from Bollinger: Bollinger uses standard deviation of the CLOSE. Keltner uses true range, which includes the high, the low and the overnight gap. So a stock that gaps and then sits quietly all day widens Keltner but barely moves Bollinger. Bollinger measures how scattered the closing prices are; Keltner measures how much ground price actually covers.
How traders use it:
• Keltner bands are smoother — fewer whipsaw touches than Bollinger
• A close outside the upper band in a strong trend is continuation, not a fade
• The centre EMA is a realistic pullback target
The one you already know: the volatility squeeze is defined as Bollinger pinching INSIDE Keltner — volatility of closes collapsing faster than the true range. That is why both are on this chart. ATR Bands and STARC Bands are the same construction with different multipliers and a different centre line.