Moving Average Envelopes
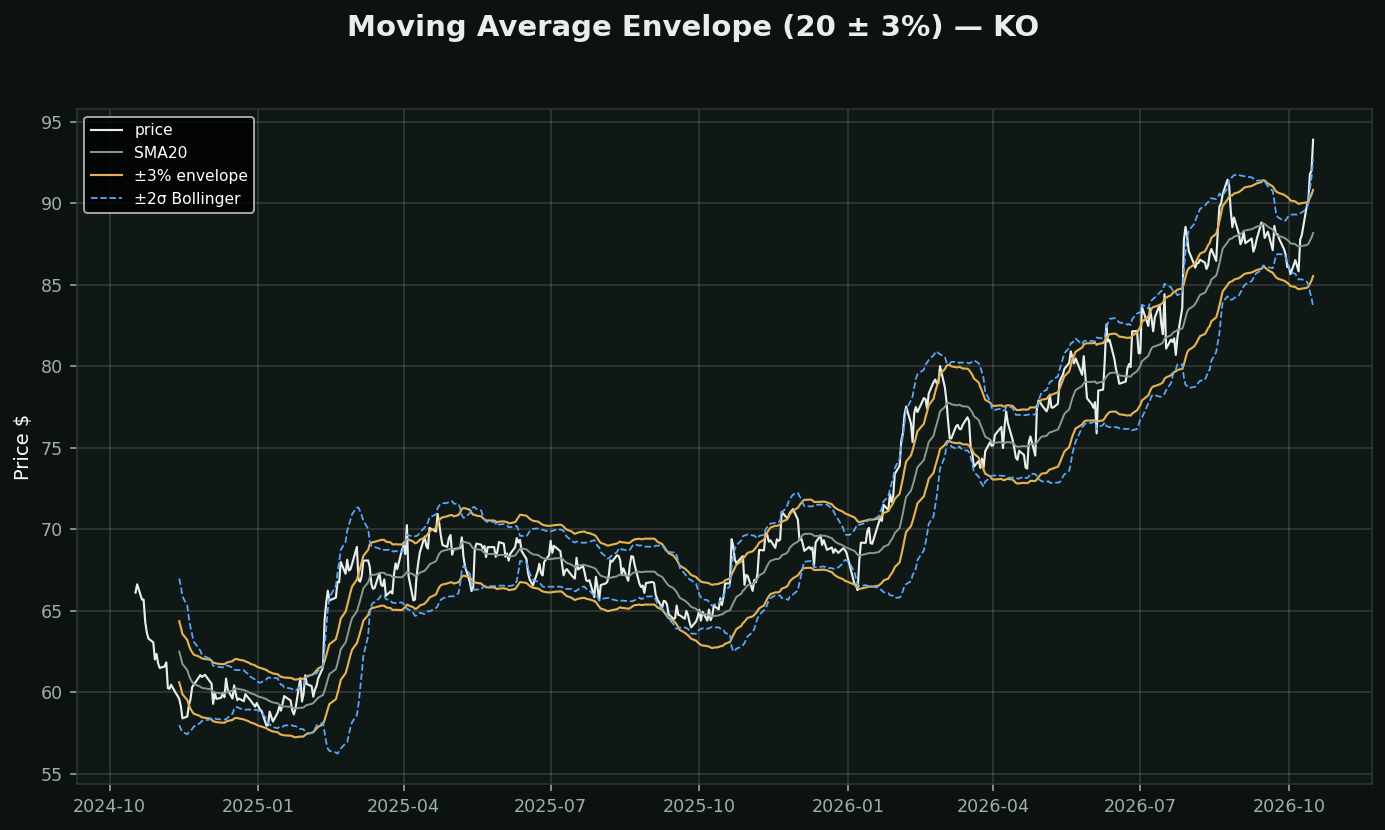
What it is: a moving average with lines drawn a fixed PERCENTAGE above and below. The oldest band study there is, predating Bollinger by decades.
The one difference from Bollinger, and it decides everything: an envelope's width is fixed. Bollinger's width is standard deviation, so it breathes with volatility. On this chart the amber lines are a flat ±3%; the dashed blue lines are ±2σ over the same window. Watch them diverge in the busy stretches.
When fixed is genuinely better: when you want a CONSTANT definition of stretched. Bollinger bands widen during a panic, so price stays inside them and the indicator quietly says "normal" during the least normal week of the year. An envelope does not move the goalposts.
When it is worse: across stocks and across time. 3% is an extreme move for a utility and a quiet Tuesday for a biotech, and a stock's own volatility changes over years. There is no universal percentage, which is exactly the problem Bollinger set out to fix.
On this chart price sat outside the envelope 20% of the time. Tune the percentage per stock against that number — an envelope nobody touches is a threshold picked by a stranger.