Negative and Positive Volume Index
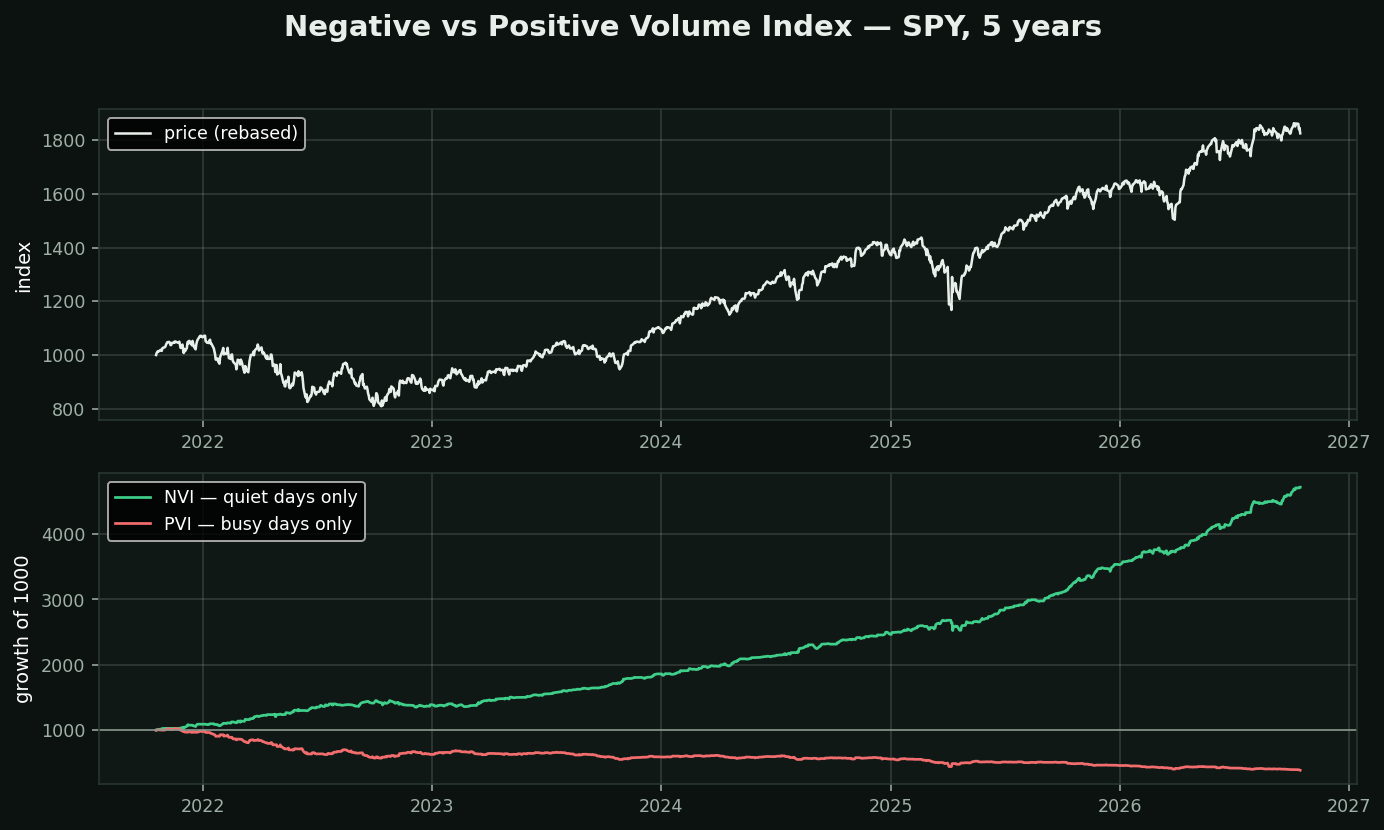
What they are: split every day into two piles. NVI compounds the return ONLY on days when volume fell from the day before. PVI compounds only the days volume rose. Run both from a base of 1000 and see which pile made the money.
The theory, from Norman Fosback: the smart money trades on quiet days, when nothing is happening and nobody is watching. The crowd trades on loud days — the news, the gap, the headline. So NVI is supposed to track the informed money and PVI the uninformed.
On this chart: over five years, quiet days turned 1000 into 4,715 and busy days into 387. They are not close, and that gap is the entire argument.
How it is traditionally used: NVI above its own one-year average was said to indicate a bull market with high probability. Note the shape of that claim — a single threshold, one market, decades ago.
Treat it as a curiosity with a real idea inside it. The idea worth keeping is not the indicator: it is that *volume-conditioned returns behave differently from unconditional ones*, which is a testable statement and the kind of thing a cross-section can check. The indicator itself is a narrative that has never been held to that standard here.