P/B (price-to-book)
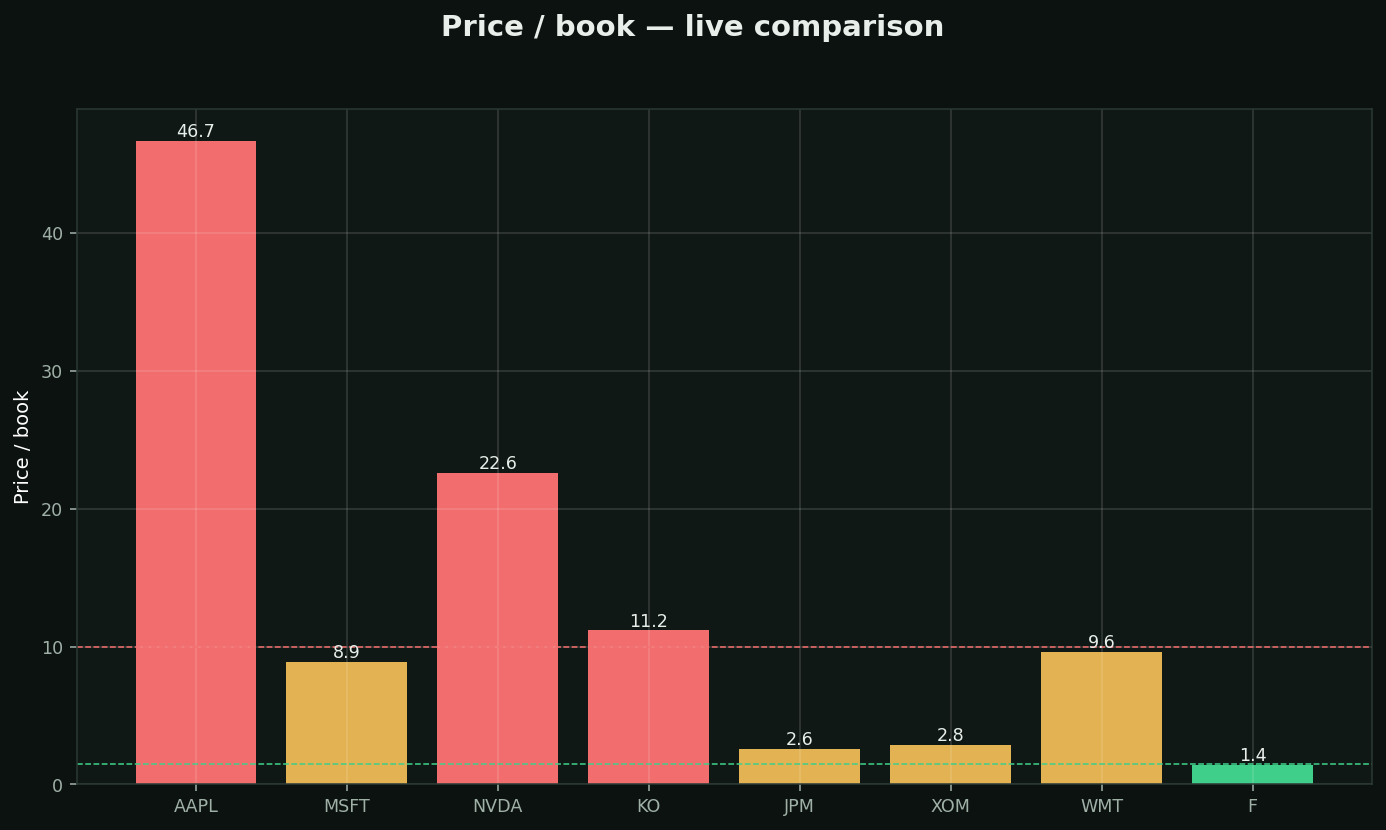
What it is: price vs the company's net assets on paper — what would theoretically remain if it sold everything and paid all debts.
Rules of thumb:
• Under 1 = trading below liquidation value — either a bargain or a business the market thinks is DESTROYING asset value
• Under 1.5 (green) = classic value zone · the metric of choice for banks and insurers, whose assets are actual money
Why it broke for tech: book value counts factories and cash, but not brands, code, or network effects — the things modern moats are made of. NVDA at P/B 40 isn't "overvalued vs KO at 10"; they're different species. Use P/B within asset-heavy industries, ignore it elsewhere.