Bollinger %b
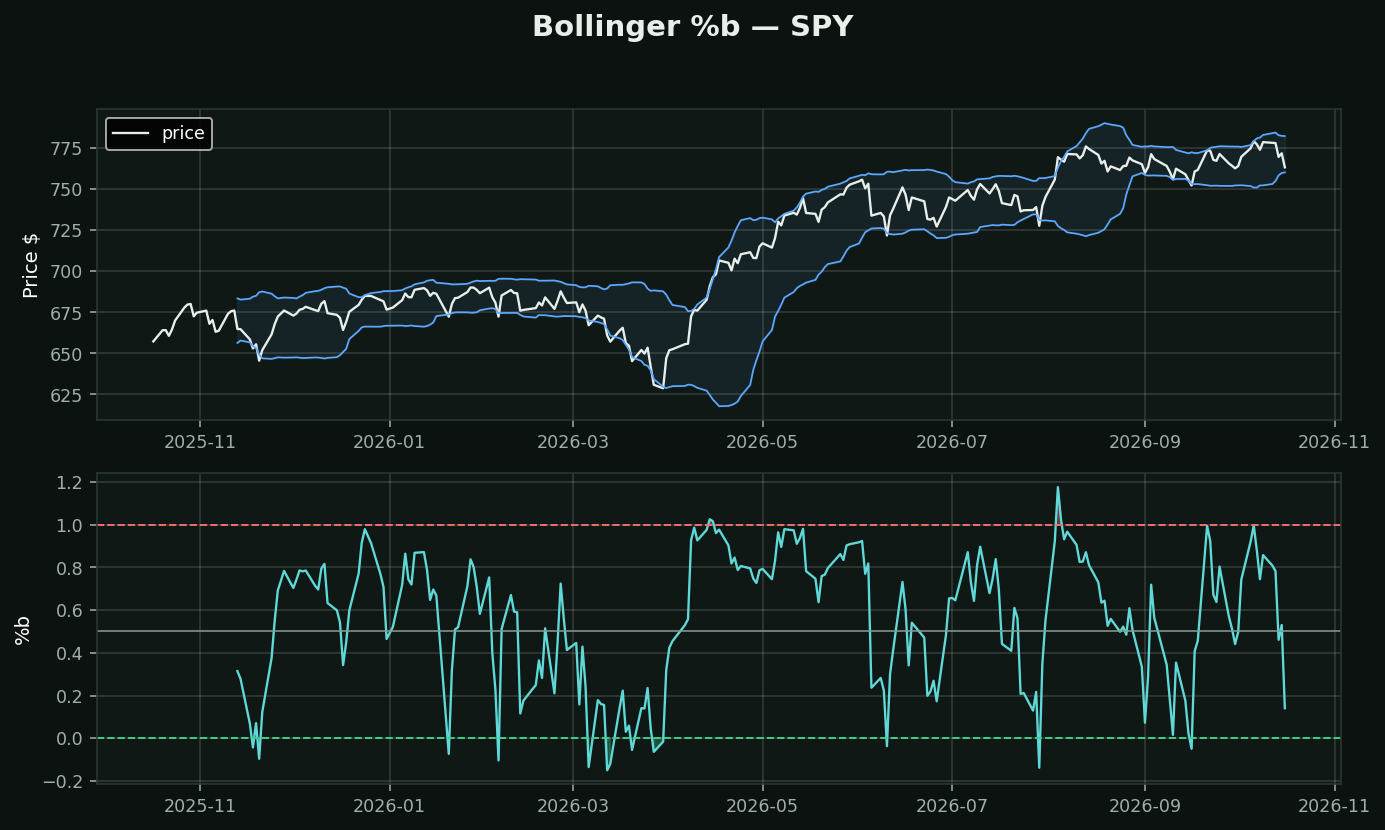
What it is: where price sits between the Bollinger bands as a single number. 1.0 is exactly on the upper band, 0.0 on the lower, 0.5 on the middle. Above 1 or below 0 means price is outside the bands.
Why bother when you can see the bands: because a picture cannot be screened, alerted on, or backtested. "Price is riding the upper band" is a description. "%b has been above 0.9 for six sessions" is a condition a computer can find across 500 names.
The pair it belongs to: %b tells you WHERE price is in the bands; Bandwidth tells you HOW WIDE the bands are. Together they turn the whole Bollinger picture into two numbers, which is what Bollinger himself recommended.
How traders use it:
• %b > 1 in a downtrend → fade it. %b > 1 in an uptrend with rising volume → that is a breakout, not an extreme
• Divergence: price makes a higher high but %b does not — the new high is less stretched than the last, so momentum is fading
• The same close scores differently in a quiet week than a wild one, which is the point
What testing here found: the contrarian read on this family holds up. Across 413,946 stock-days, RSI-oversold names beat the base rate by +0.82% over the next 21 days (t=+4.09) and overbought names trailed by -0.58% (t=-4.27). Oscillators that measure stretch survived their test here; the trend-followers did not.