P/S (price-to-sales)
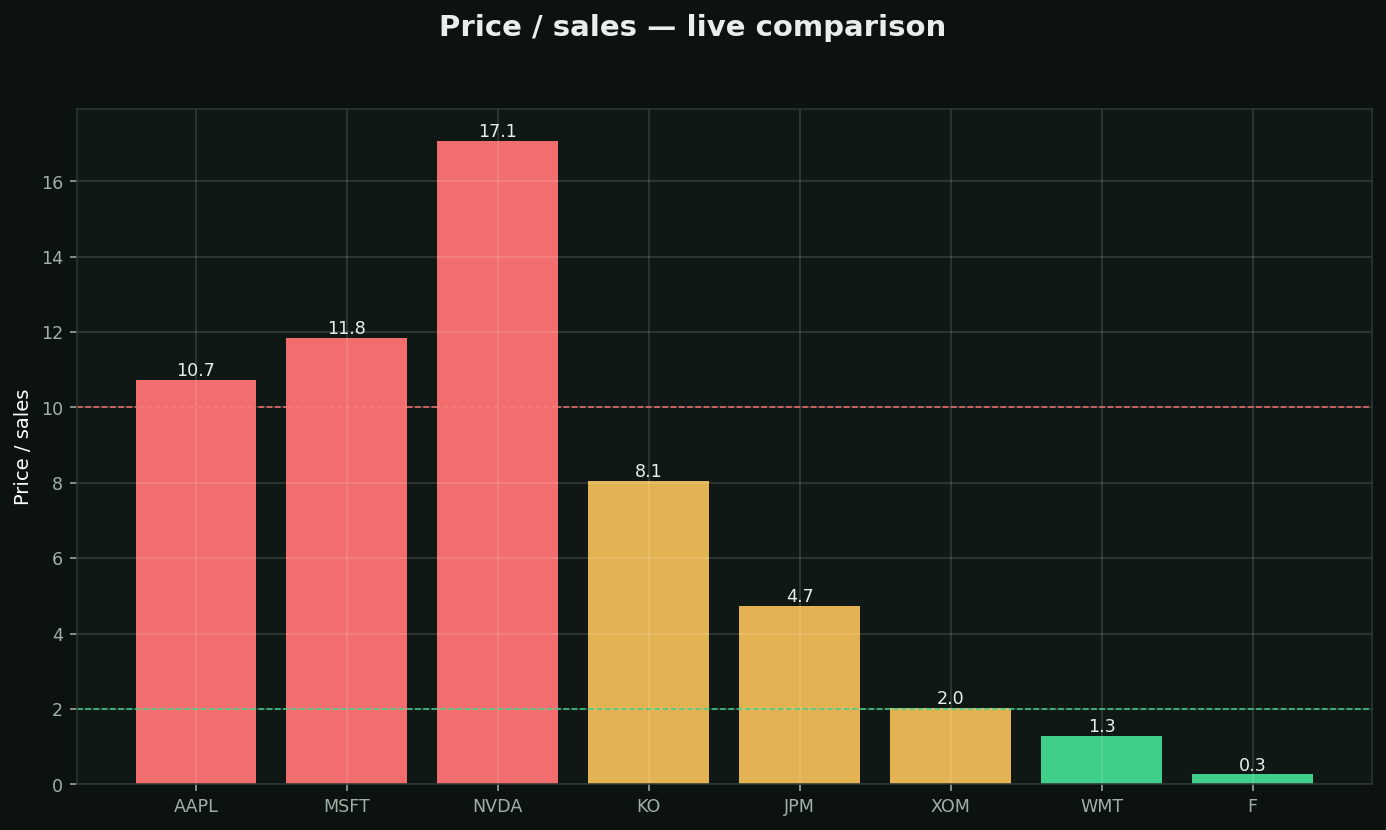
What it is: market value ÷ yearly revenue. The valuation tool for companies with no profits yet — revenue exists before earnings do, and it's much harder to fake.
Rules of thumb:
• Under 2 (green) = cheap for most businesses · over 10 (red) = priced for a spectacular future
• Ken Fisher built a career on buying good businesses under P/S 1
The margin connection — why context is everything: P/S of 8 for a 90%-gross-margin software firm can be cheaper in real terms than P/S of 1 for a 2%-margin grocer. Always read P/S together with margins: you're buying future PROFITS, and margins are the exchange rate.