Rainbow Moving Average
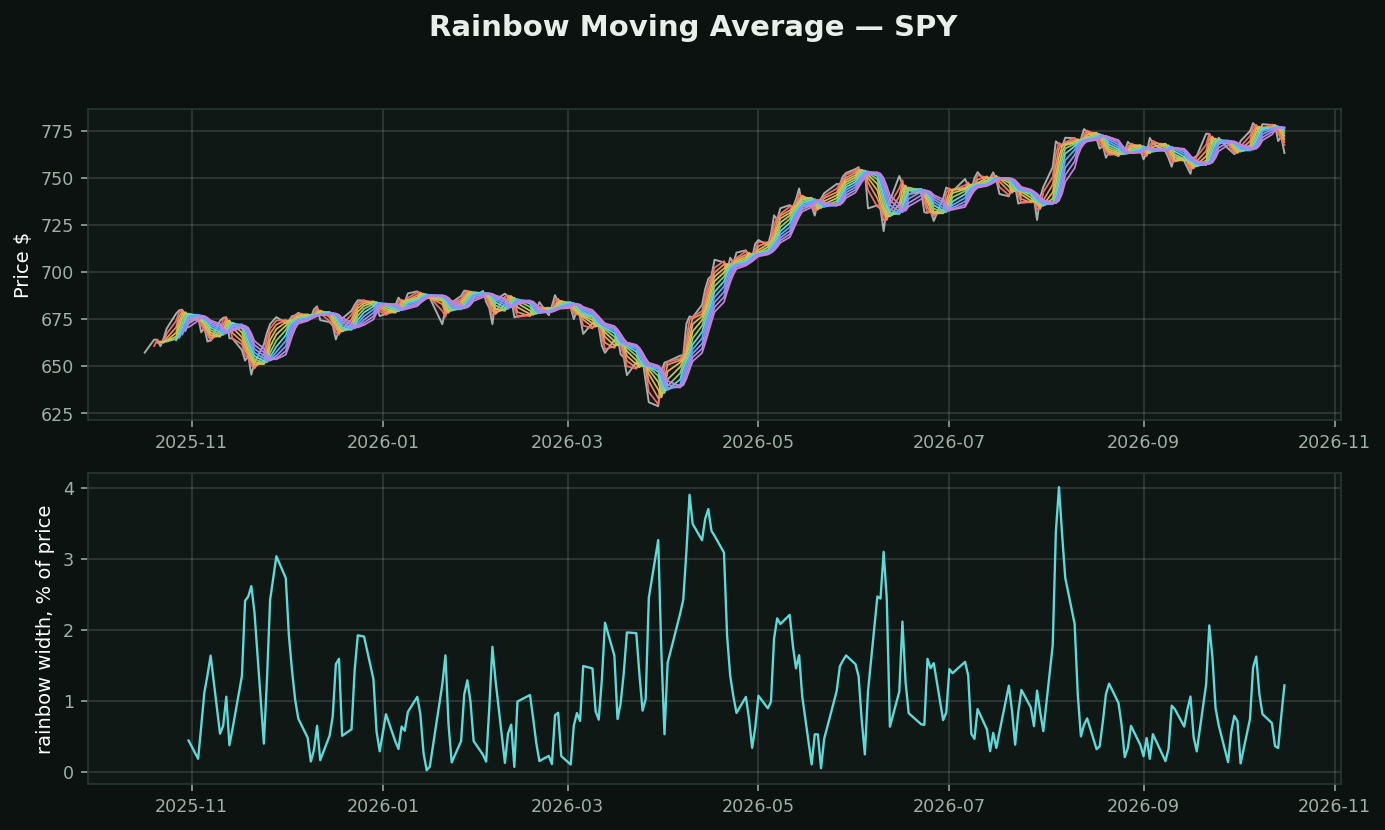
What it is: a 2-period average of price. Then a 2-period average of that. Then of that, ten times over, each drawn in its own colour. Recursive smoothing rather than ten separate lookbacks.
Why recursion instead of just plotting a 10, 20, 30…: each layer lags the one above it by a fixed, equal amount. The bands stay evenly spaced, so the WIDTH of the rainbow becomes a clean readout of how fast price is moving away from its own history. With independently chosen lookbacks the spacing is arbitrary and the width means nothing.
How it is read:
• Bands tight and interleaved → no trend, and every crossover signal you take here will be a loss
• Bands fanned and ordered → a trend with momentum behind it
• Price re-entering the rainbow → the move is over
• The bottom panel is that width as a number, which is the only part you can screen on
The category problem, stated plainly: Rainbow, Guppy, Alligator, envelopes and STARC are five commercial products built on "draw more than one moving average". They differ in count, smoothing and displacement. Not one of them knows anything the underlying averages did not already know. Learn one and you have learned the shelf.
What testing here found: this is a trend-following tool, and that family did not survive its own test. Over 413,946 stock-days, "price above its moving averages" preceded -0.46% at 21 days (t=-4.40) while downtrend preceded +1.14% (t=+6.02). Use it to describe a trend and to manage a stop — not to decide direction.