Random Walk Index
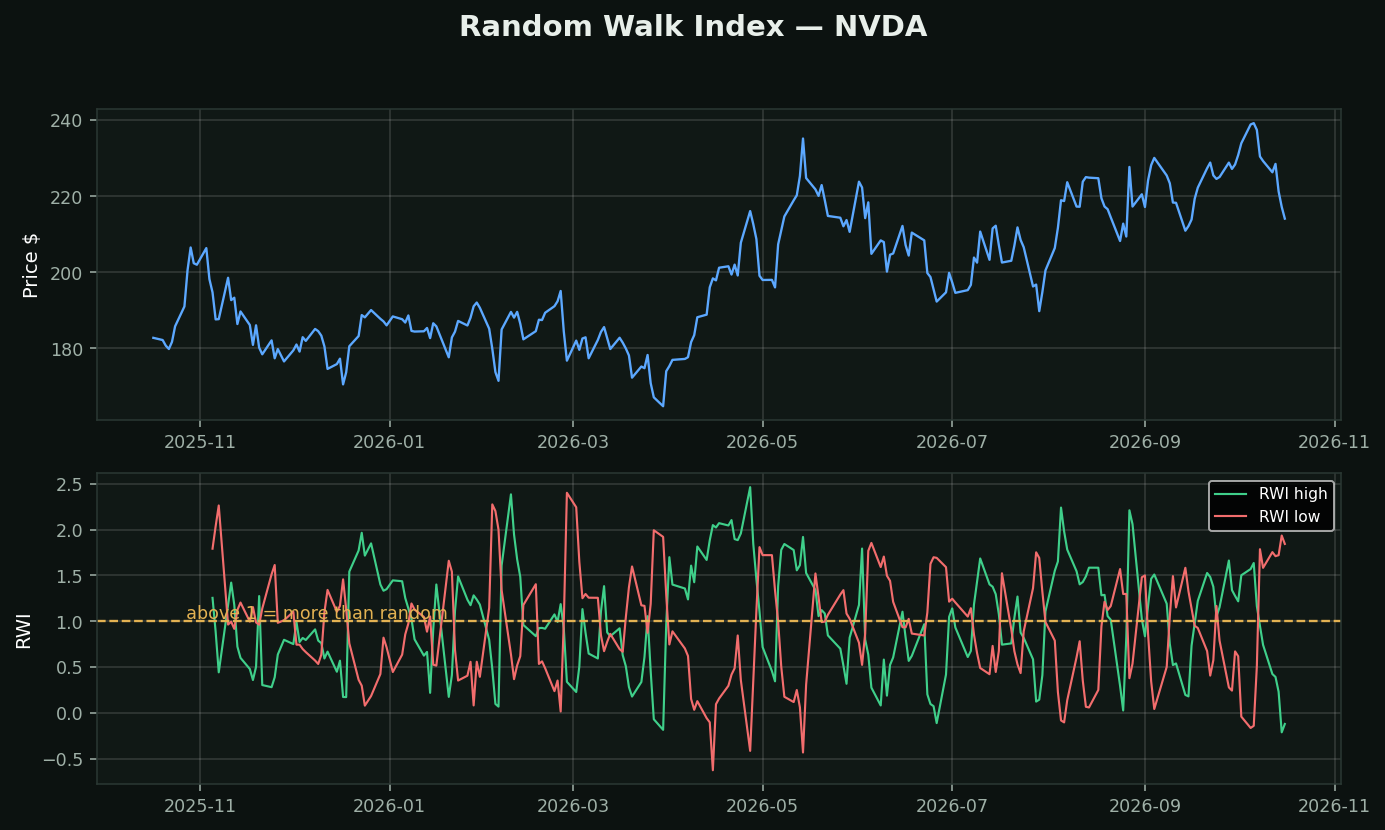
What it is: the one indicator on the whole menu that states its null hypothesis. Michael Poulos, 1991.
The question it asks: if this stock were moving completely at random, how far would it have drifted in N days? Statistics answers that — a random walk covers roughly its typical daily move times the square root of N. RWI divides the ACTUAL distance travelled by that random-walk expectation.
So the scale means something real:
• RWI = 1 → this move is exactly what chance would produce. Nothing to explain
• RWI > 1 → price has travelled further than randomness accounts for. There is a trend
• The higher above 1, the less likely chance explains it
Why this deserves your attention more than most of the library: every other trend indicator outputs a number you then compare to a threshold somebody picked by eye — ADX 25, choppiness 61.8, CCI 100. RWI compares against the *only* baseline that is not arbitrary: what would have happened anyway.
That is the discipline this whole toolkit runs on. A signal is only worth something measured against the base rate. RWI builds that comparison into the indicator.
How traders use it: RWI-high above 1 with RWI-low below 1 is an uptrend; both near 1 is noise, and no trend tool will work.
What testing here found: this is a trend-following tool, and that family did not survive its own test. Over 413,946 stock-days, "price above its moving averages" preceded -0.46% at 21 days (t=-4.40) while downtrend preceded +1.14% (t=+6.02). Use it to describe a trend and to manage a stop — not to decide direction.