Relative Vigor Index
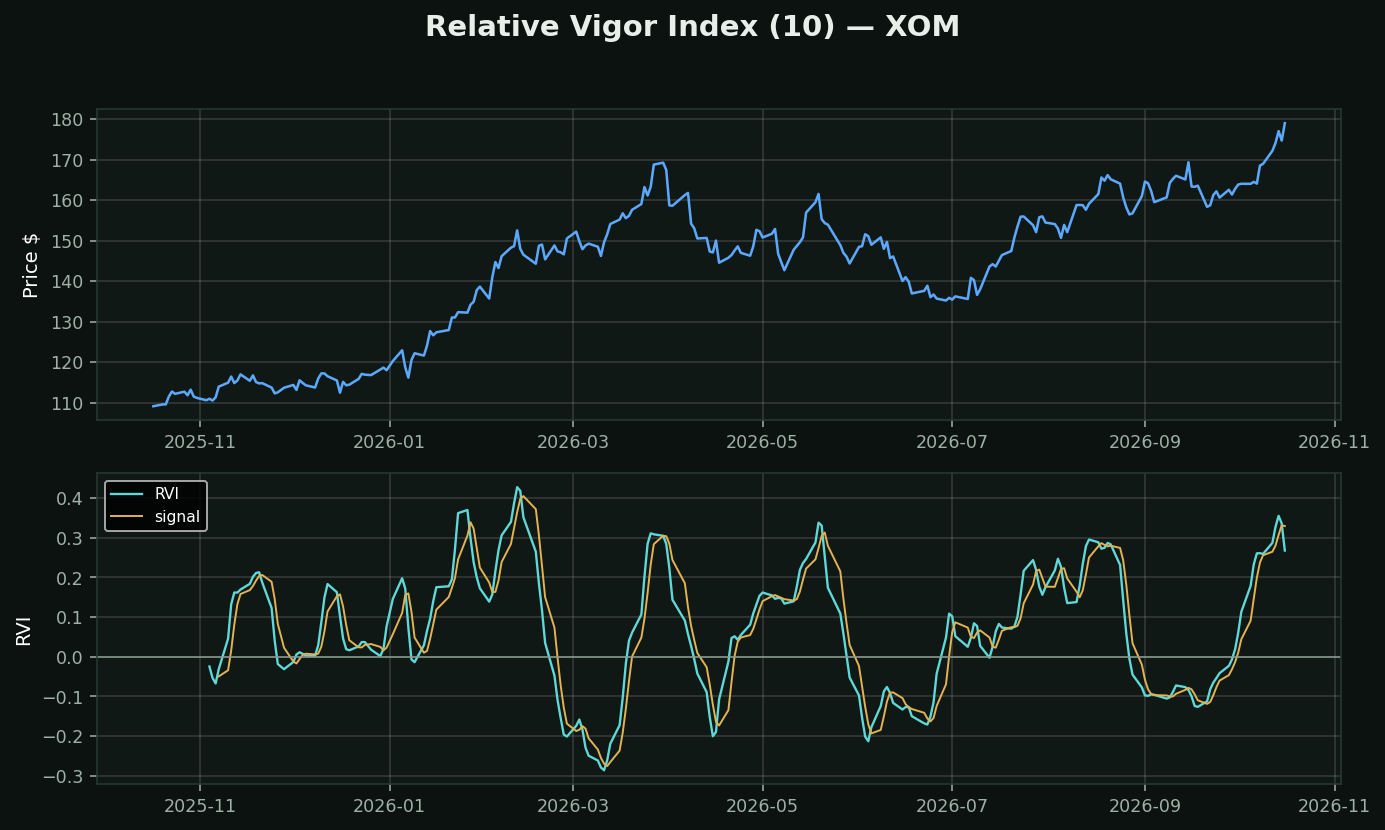
What it is: Balance of Power's idea, smoothed and turned into a proper oscillator. Average of (close − open) divided by average of (high − low), over 10 periods, with a weighted smoothing applied to both halves first.
The premise in one line: *in an uptrend, stocks close above where they opened; in a downtrend, below.* That is it. Everything else is arithmetic to make the premise readable.
Why it matters that it uses the OPEN: almost nothing else in the study library does. RSI, MACD, Stochastic, CCI, ROC — all close-to-close. The open-to-close relationship is genuinely separate information, and on a chart full of correlated indicators, separate information is the rare thing.
How traders use it:
• Signal-line crossings — the signal is the same line re-smoothed, which is a weak construction and produces frequent crosses
• Divergence against price, which is the honest use
• Gaps break it: a stock that gaps up 5% and then drifts down all day reads as weakness here, even though holders are up
Family: BOP is the unsmoothed daily version of this.