Stochastic oscillator
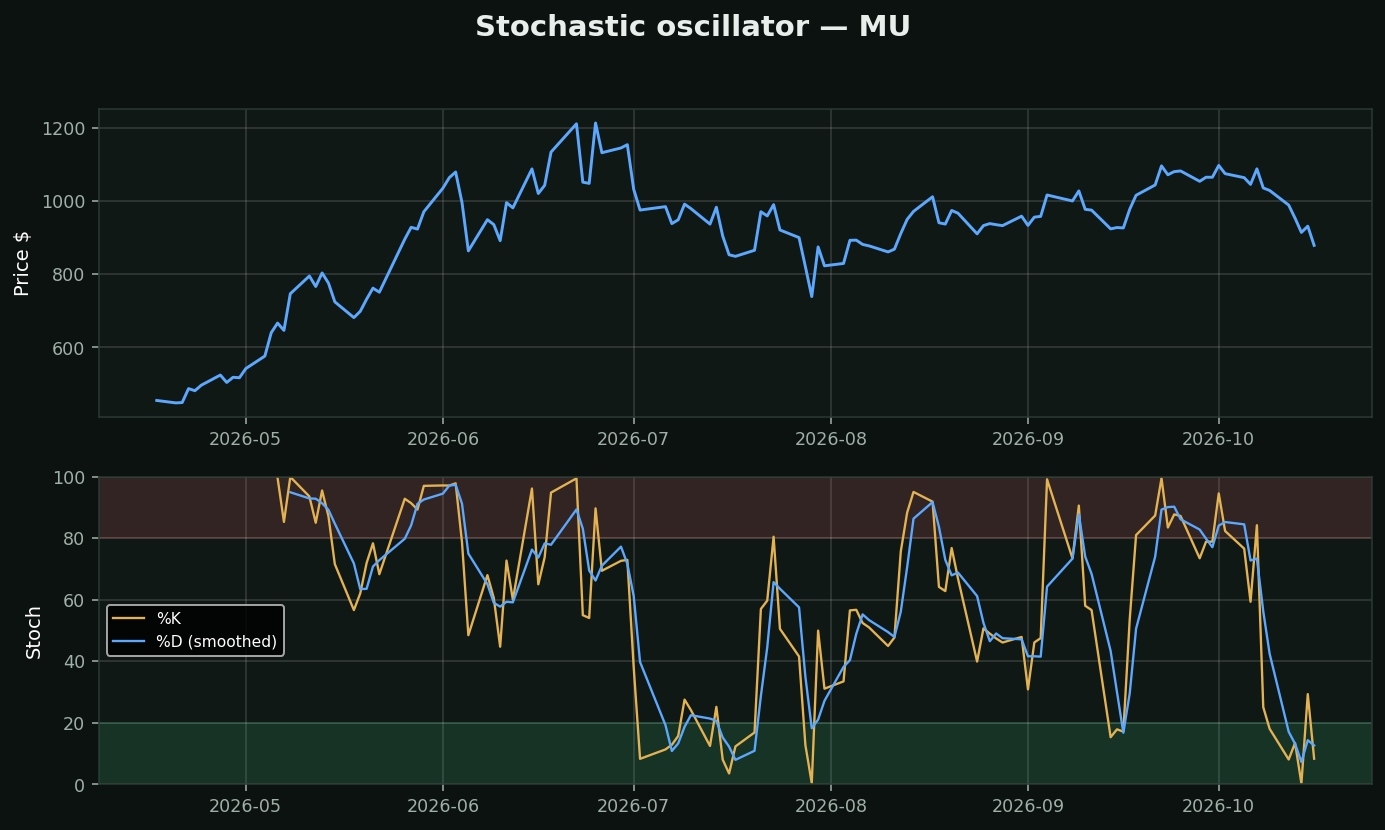
What it is: where today's close sits inside the last 14 days' range. 100 = closing at the very top of the range, 0 = at the very bottom.
How to read it:
• Above 80 = closing near range highs (hot) · below 20 = near lows (washed out)
• The classic trigger: %K crossing back UP through %D from below 20
Stochastic vs RSI: same family, different personality — stochastic is faster and twitchier. Best in SIDEWAYS ranges where price ping-pongs; in strong trends it pins above 80 for weeks and fools you. Range market → stochastic. Trending market → ignore it.