Twiggs Money Flow
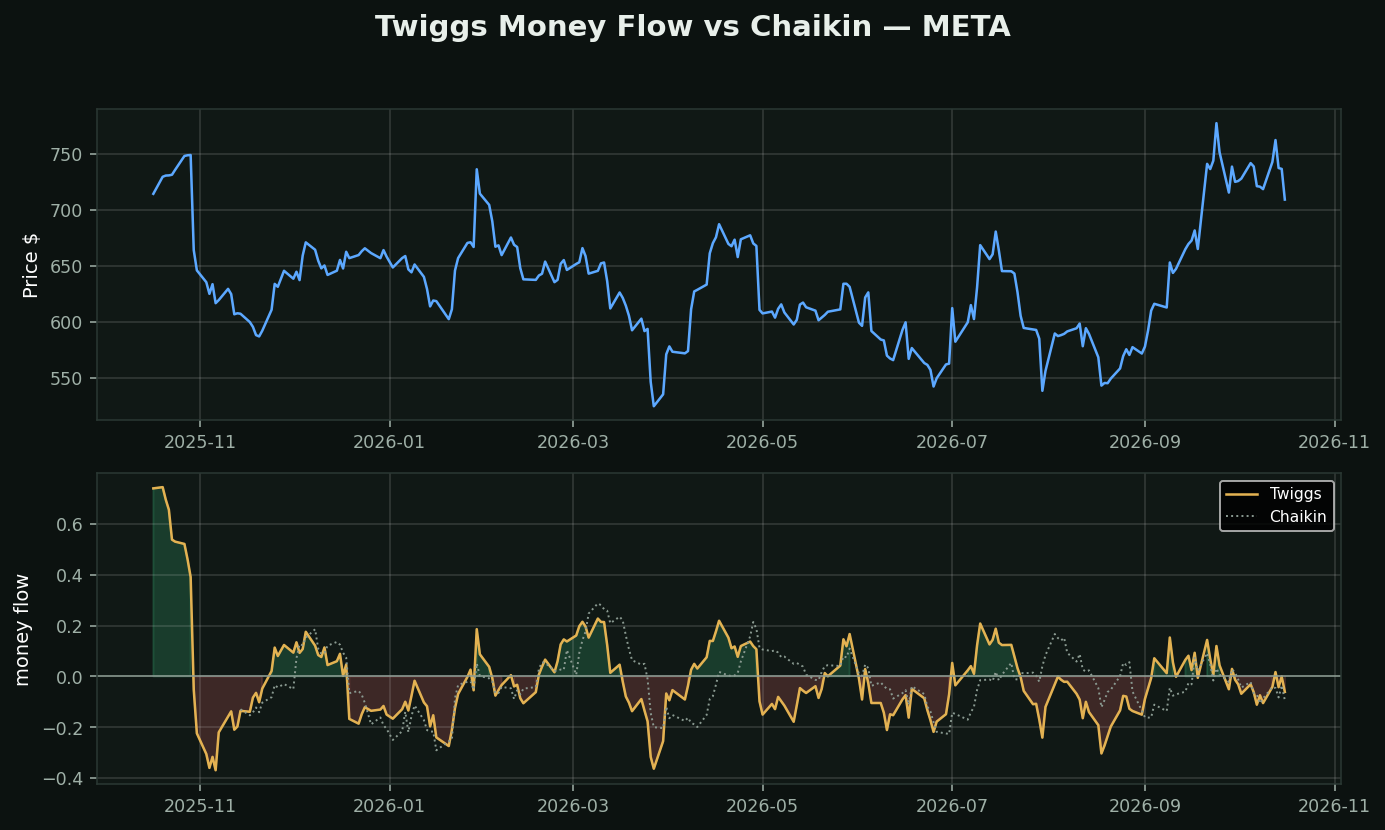
What it is: Colin Twiggs' repair of Chaikin Money Flow. Same question — where did the close land in the range, weighted by volume — with two specific fixes.
Fix one: use the TRUE range. Chaikin measures the close against today's high and low only. If a stock gaps down 10% and then closes at the top of its new, much lower range, Chaikin reads that as strong accumulation. Twiggs extends the range to include yesterday's close, so the gap is part of the measurement. That is the same true-range idea behind ATR, applied to money flow.
Fix two: exponential smoothing instead of a 21-day sum. A simple rolling sum drops a big day off the back end 21 days later, which produces a jump in the indicator on a day when nothing happened. Exponential weighting has no back end and no phantom jumps.
On the chart the dotted grey line is Chaikin over the same window. They agree most of the time and separate exactly around gaps — which is precisely where you most need the reading to be right.
How to use it: persistent above zero is accumulation, below is distribution, and divergence against price is the real signal. Same as Chaikin, with fewer wrong answers on the days that matter.