Ultimate Oscillator
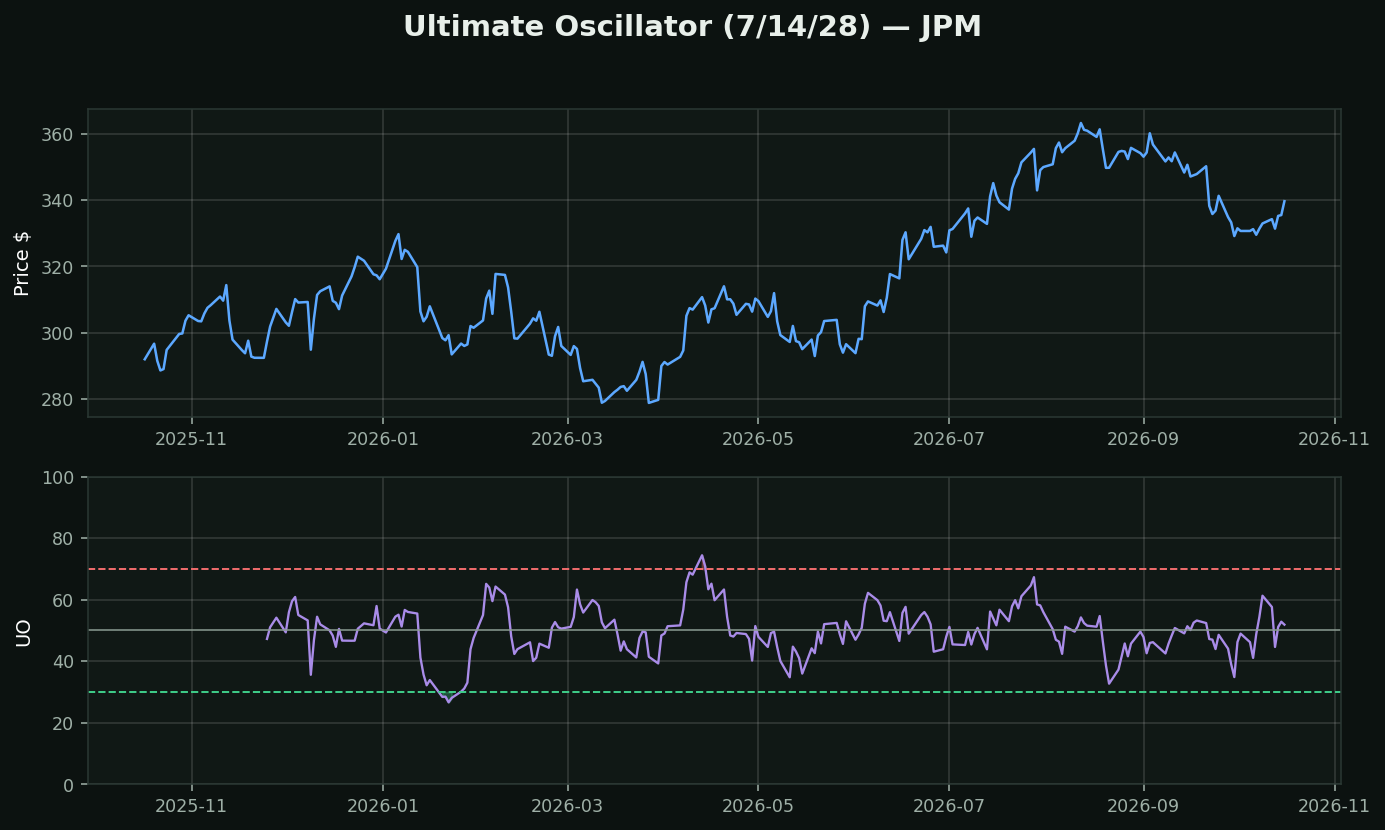
What it is: Larry Williams, 1976, built to fix a problem he had with every oscillator including his own — the lookback you choose decides the answer you get. A 7-day oscillator and a 28-day one routinely disagree on the same chart, and picking the one that agrees with you is not analysis.
His fix: run three lookbacks at once — 7, 14 and 28 — and blend them 4:2:1, short weighted heaviest. One number that has already accounted for three time horizons.
The other good idea in here — buying pressure. Instead of raw price change it uses close minus *the lower of today's low or yesterday's close*. That includes the overnight gap, so a stock that gaps down and then rallies all day is correctly read as strength. Most oscillators miss that entirely.
How traders use it: Williams' own rule needed three things together — bullish divergence, the divergence low above 30, then a break of the divergence high. That specificity is rare in technical analysis and worth respecting.
Honestly: the multi-timeframe blend is a genuinely good idea that almost nothing else on the menu copies.
What testing here found: the contrarian read on this family holds up. Across 413,946 stock-days, RSI-oversold names beat the base rate by +0.82% over the next 21 days (t=+4.09) and overbought names trailed by -0.58% (t=-4.27). Oscillators that measure stretch survived their test here; the trend-followers did not.