Williams %R
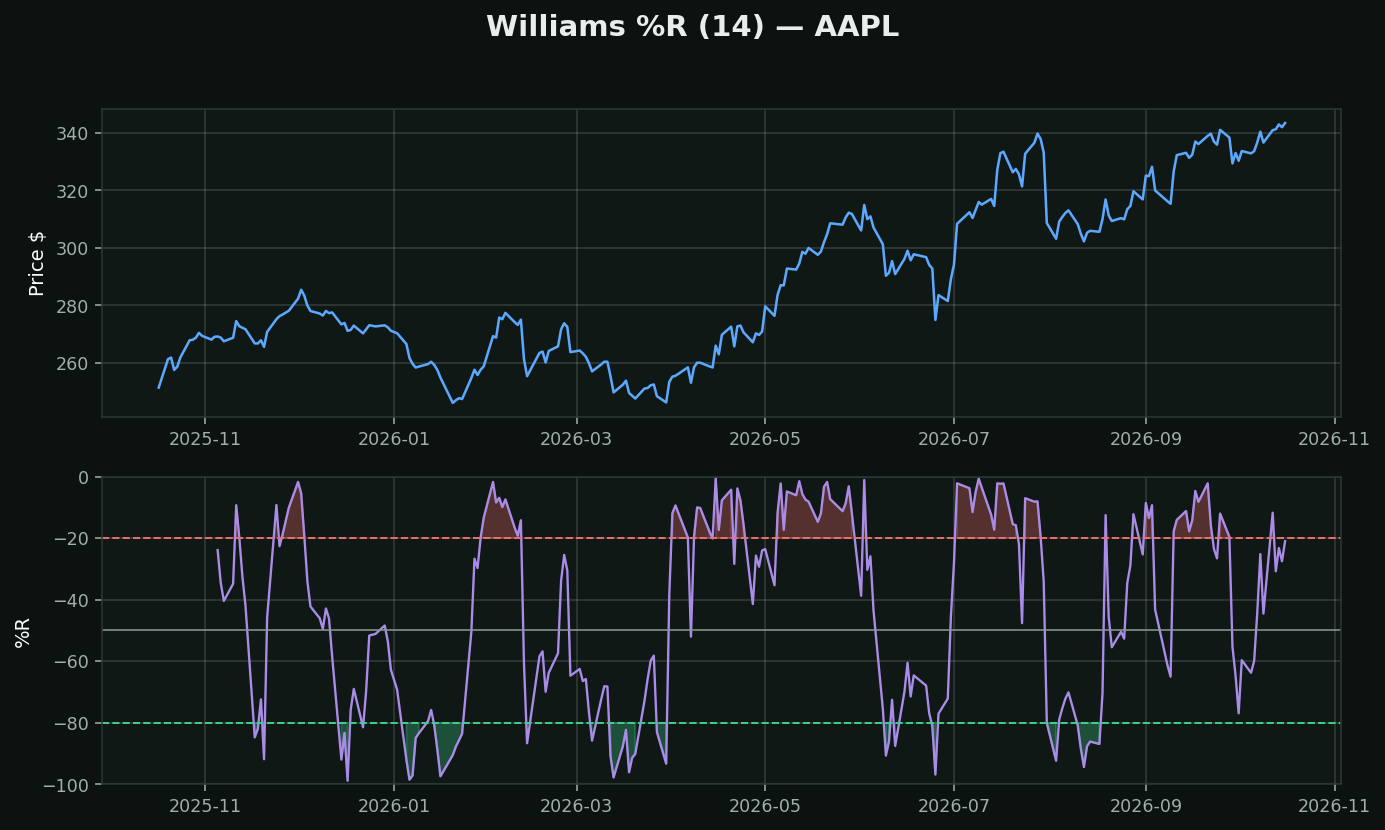
What it is: where today's close sits inside the last 14 days' high-to-low range, on a scale from 0 (right at the high) to -100 (right at the low). Larry Williams, 1973.
The honest comparison: this is Stochastic %K, upside down and unsmoothed. `%R = %K - 100`. Not similar to — *arithmetically the same line*. If you already run Stochastic, adding this is adding a second copy of a chart you have.
What it does better: no smoothing means no lag. Stochastic's 3-period %D smooths out noise and, with it, the turn. %R prints the extreme on the day it happens, which matters if you are fading a washout rather than waiting for confirmation.
How traders use it:
• -20 to 0 → closing at the top of the range, stretched up
• -80 to -100 → closing at the bottom, stretched down
• In a real trend it pins at one extreme for weeks. That is the signal failing, not the trend being extraordinary — pair it with Choppiness and switch it off below 38
What testing here found: the contrarian read on this family holds up. Across 413,946 stock-days, RSI-oversold names beat the base rate by +0.82% over the next 21 days (t=+4.09) and overbought names trailed by -0.58% (t=-4.27). Oscillators that measure stretch survived their test here; the trend-followers did not.