Donchian Width
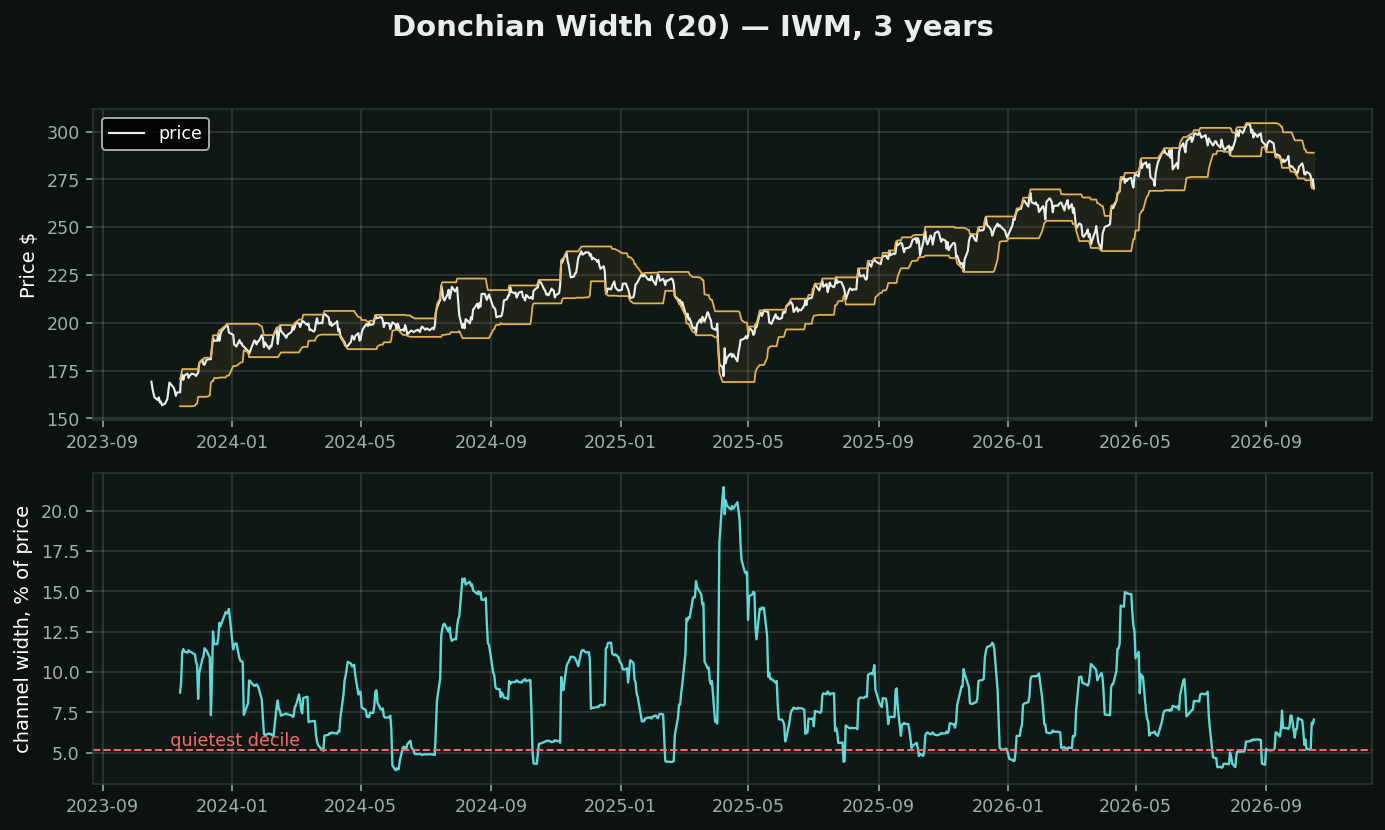
What it is: the distance between the 20-day high and the 20-day low, as a percentage of price. The Donchian channel expressed as one number instead of two lines.
How it differs from the other width measures — and it is a real difference. Bollinger Bandwidth is built on the standard deviation of CLOSES. ATR is built on the average of daily ranges. Donchian Width uses the actual extremes — the single highest high and lowest low in the window.
That makes it the only one that a single day can change. One violent session sets a new extreme and the width jumps, and it stays jumped for twenty days until that bar rolls out of the window. Bollinger and ATR average the same event away.
Which behaviour you want depends on the question. If you are sizing a position against typical movement, you want the average — use ATR. If you are asking *what is the worst this thing has done lately*, you want the extreme, and that is this.
Chart: IWM's channel is 7.0% wide against a three-year quiet-decile floor of 5.2%.
How traders use it: a width at multi-month lows is a compression signal, the same message as a Bollinger squeeze from a different direction. The Turtles used width directly for position sizing — wider channel, smaller position.