Elder Impulse System
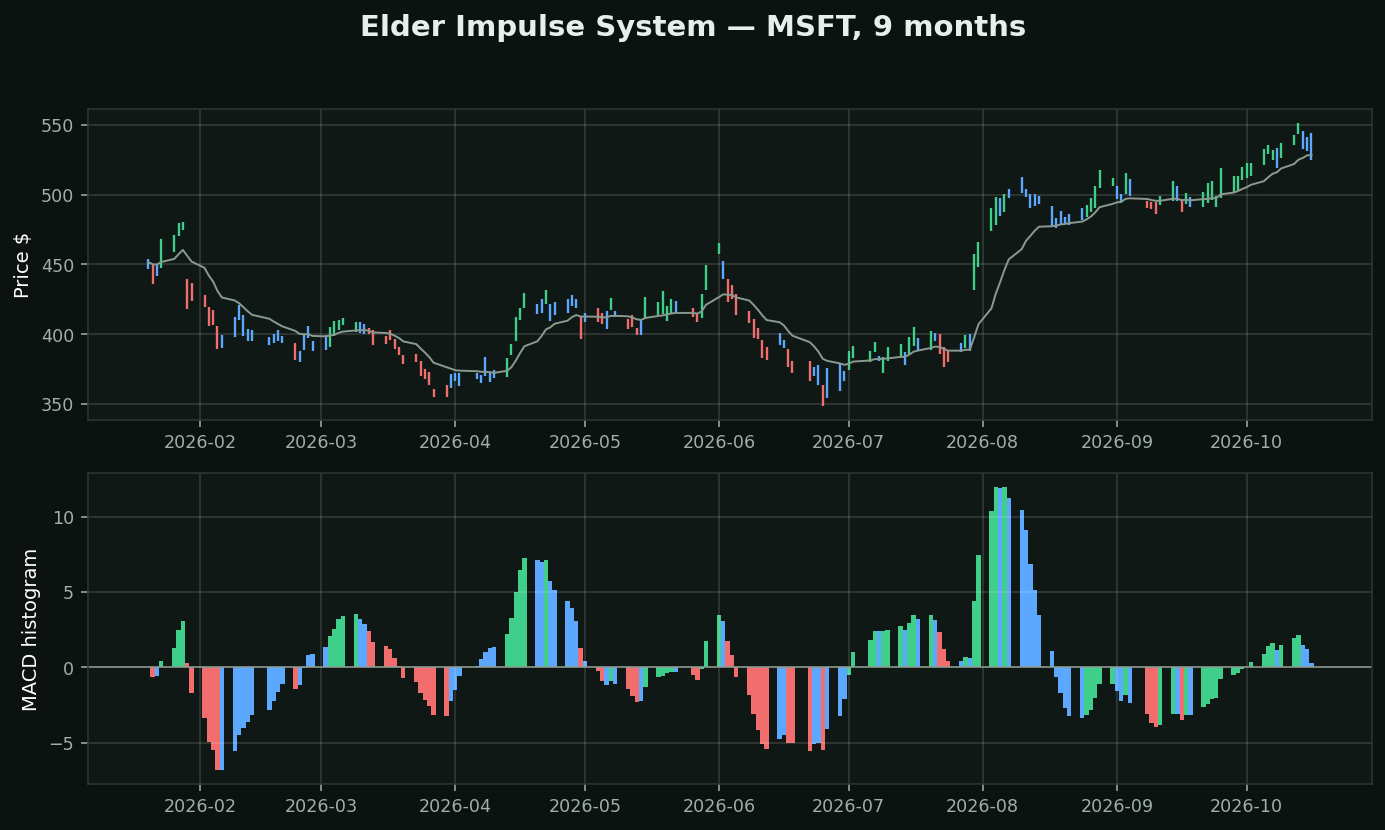
What it is: each bar gets one of three colours, from two conditions — is the 13-day EMA rising, and is the MACD histogram rising?
• Green — both rising. Bulls in control of trend AND momentum
• Red — both falling
• Blue — they disagree. The impulse has gone
The part that makes it different from every other system here: it is a censorship system, not a signal system. Elder's rule is not 'buy green'. It is:
> *A green bar forbids you from being short. A red bar forbids you from being long.*
It removes options rather than issuing instructions. Blue — the most common colour — means the system has nothing to say, and Elder wanted that state to be visible rather than hidden behind a line that keeps plotting regardless.
On this chart: 65 green, 48 red, 75 blue. The system is explicitly neutral most of the time, which is a more honest posture than most of the library manages.
Why it belongs on a beginner's chart: the single most expensive habit in retail trading is needing to have a position. A tool whose default output is 'no opinion' is teaching the right reflex.
What testing here found: this is a trend-following tool, and that family did not survive its own test. Over 413,946 stock-days, "price above its moving averages" preceded -0.46% at 21 days (t=-4.40) while downtrend preceded +1.14% (t=+6.02). Use it to describe a trend and to manage a stop — not to decide direction.