Fibonacci fans and arcs
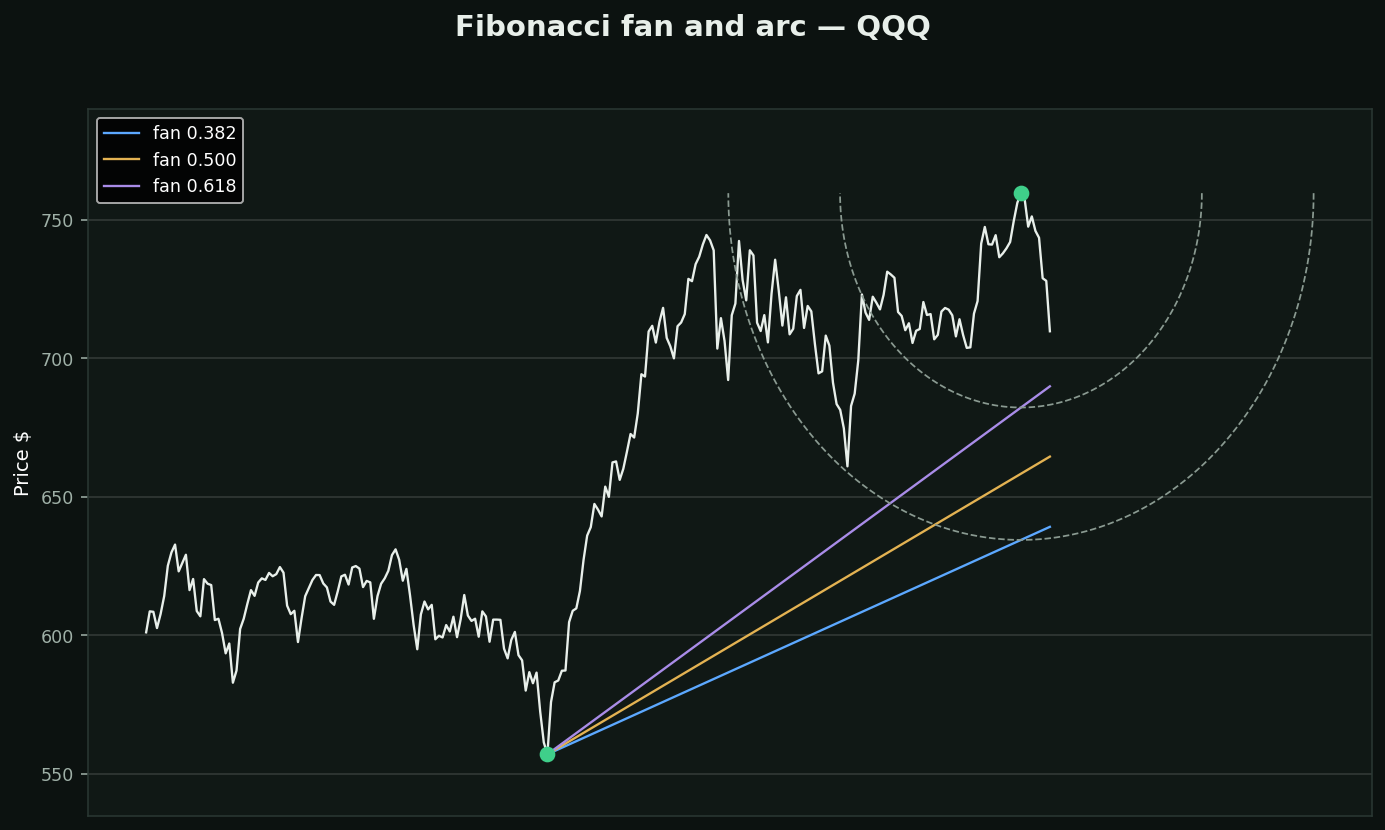
What they are: the retracement idea rotated. A fan draws sloping rays from the anchor through the Fibonacci levels, so support falls over time instead of sitting flat. An arc draws curves at Fibonacci distances from the pivot, so support depends on price and elapsed time together.
The extra problem they carry: an arc is a circle in screen pixels, not in data. Price is dollars and the other axis is days — a circle only exists once you fix how many pixels a dollar and a day are worth. Resize the window and the arc changes shape. Zoom in and it crosses price somewhere else entirely.
So a level from an arc depends on your monitor, your zoom and your window size. Two traders at the same desk get different answers from the same tool on the same stock.
Fans have the same disease in milder form: the ANGLE of the ray is scale-dependent even though the level it starts from is not.
How to use them without fooling yourself: treat a fan as a moving reference that decays over time, and read the price where it crosses today rather than the angle. Never quote an arc level to anyone without saying what your axes were.
The deeper problem: you choose the two anchor points. Move them one bar and every level moves with them. A tool whose output depends on a choice you make cannot be backtested, because there is no rule to test — and a method that cannot be shown wrong cannot be evidence.