the Gann fan
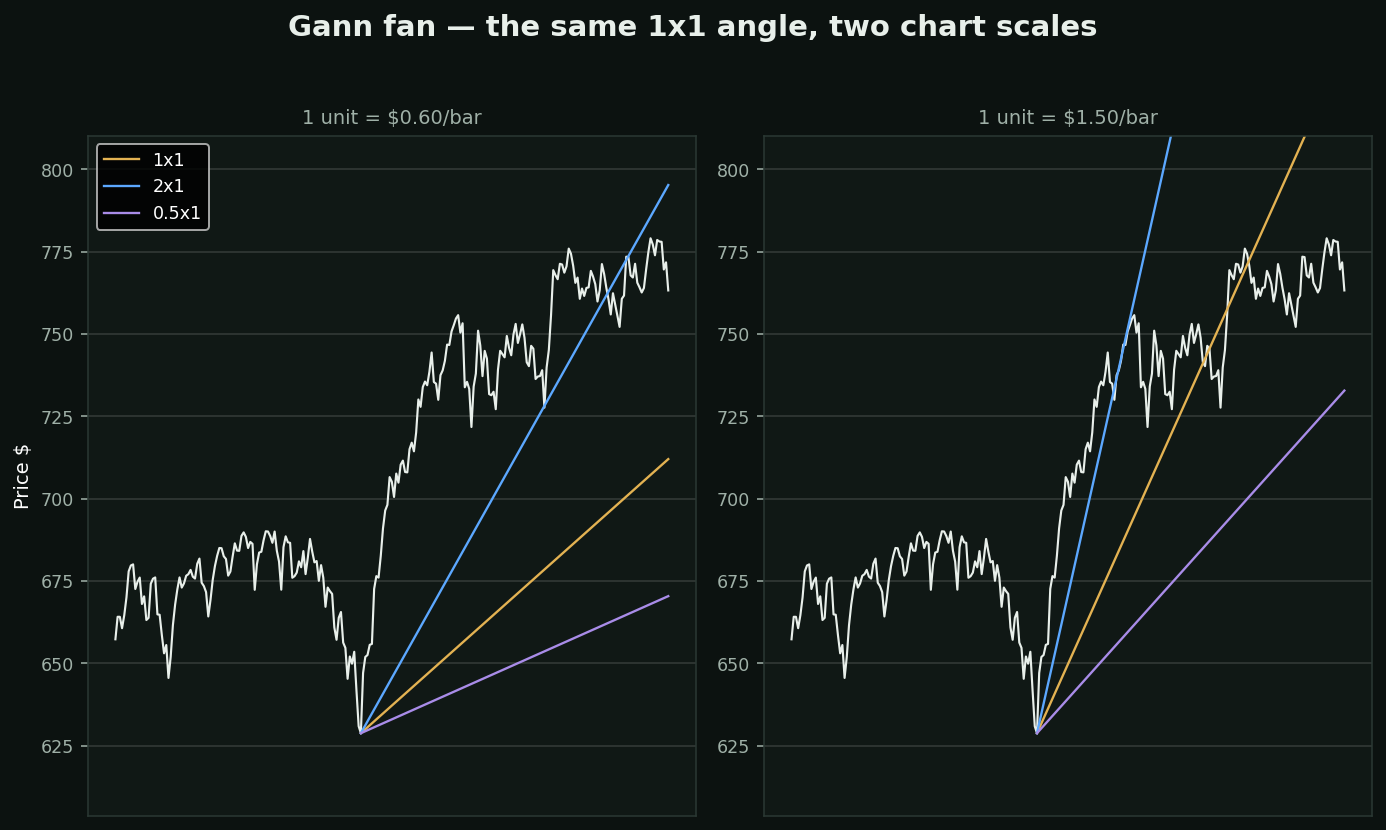
What it is: W.D. Gann held that price and time are related by simple ratios, and drew rays at 1×1, 2×1, 1×2 and so on from a pivot. The 1×1 — one unit of price per unit of time — is the 'most important angle on the chart'.
The question nobody answers: one unit of WHAT? An angle on a chart is not a property of the market. It depends on how many dollars tall and how many days wide you drew the chart.
Both panels are the same stock, same pivot, same 1×1 rule. The only difference is what one 'unit' of price is worth. The fans point somewhere completely different, and each one implies different support on different dates.
That is not a criticism of Gann's arithmetic — it is the observation that a slope has units, and this tool never fixes them. On Gann's own hand-drawn charts the scale was standardised by the paper. On a screen you can zoom, and every zoom is a different forecast.
If you use it: lock the chart scale, write down what one unit means, and never compare a fan across two charts drawn differently. Speed Resistance Lines and Speed Resistance Arcs are the same construction and inherit the same problem.