Gaps
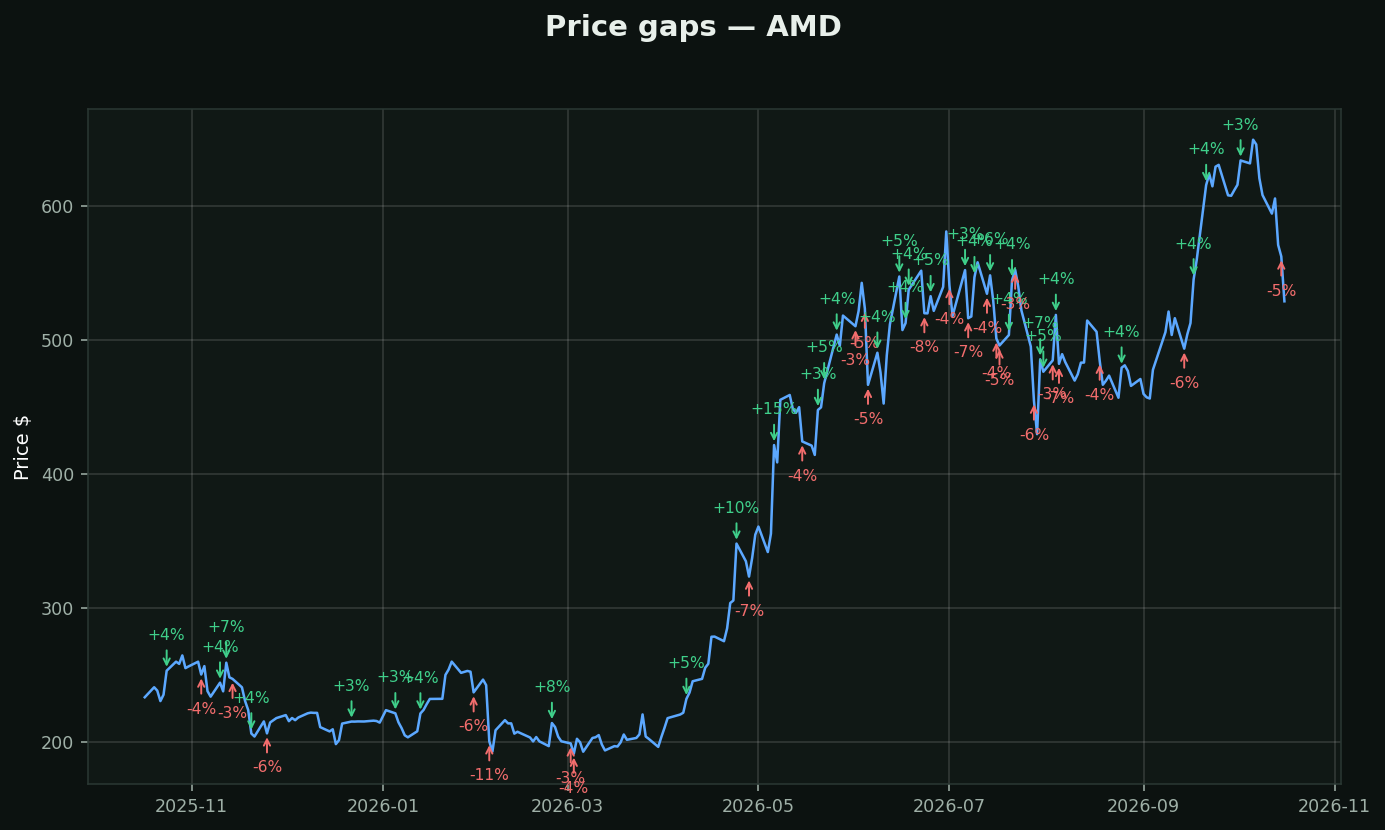
What they are: price jumping past a whole range with zero trading in between — news landed while the market was closed. Arrows mark this stock's 3%+ gaps this year.
The three kinds:
• Breakaway — gap OUT of a base on huge volume: the start of something; rarely fills soon
• Runaway — gap mid-trend: the move is accelerating
• Exhaustion — gap after a long run that quickly reverses: the last buyers just arrived
About "gaps always fill": they don't. Our own scanner measured it — most 2%+ gaps in strong stocks DON'T fill same-day. The saying survives because filled gaps are memorable. Trade the gap's TYPE, not the folklore.