Gopalakrishnan Range Index
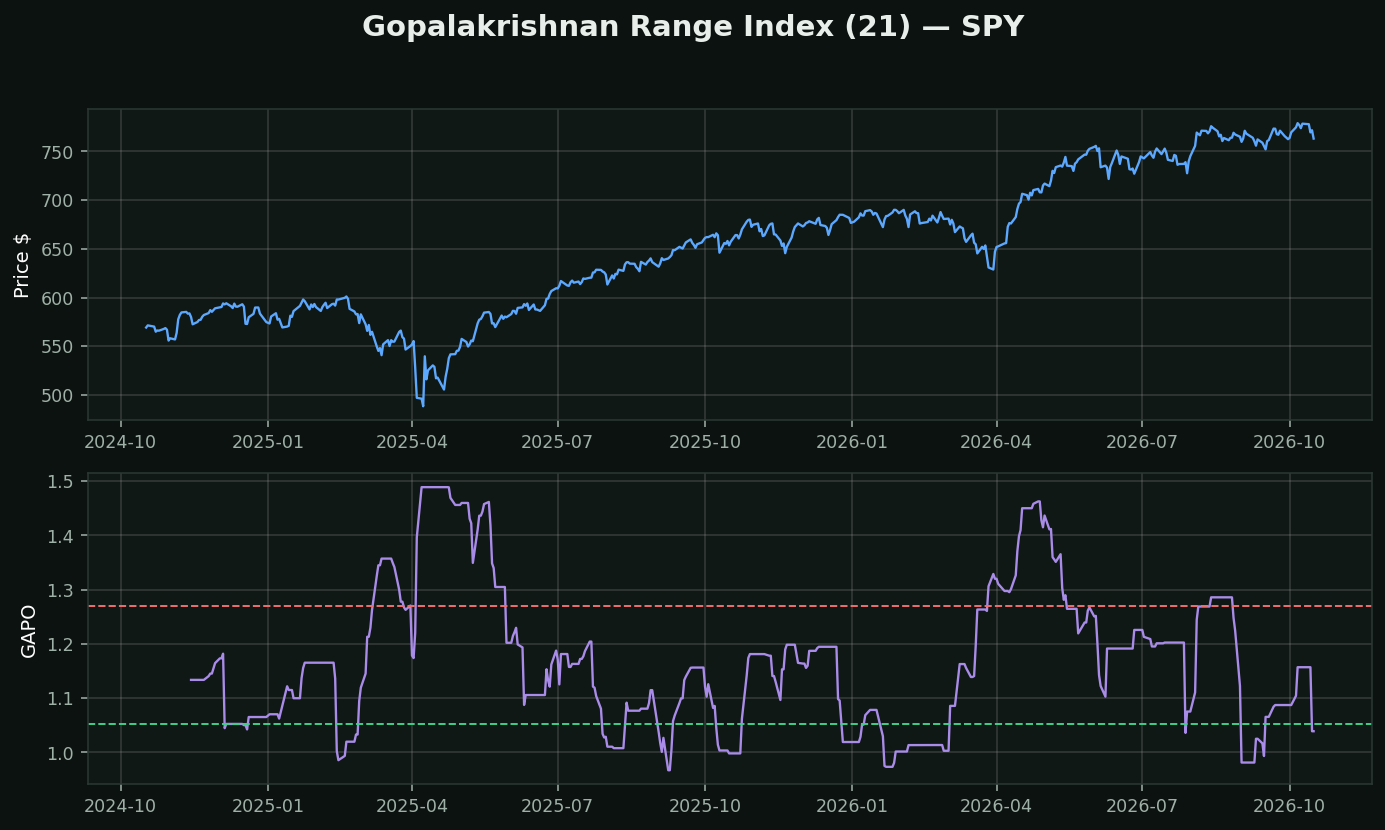
What it is: the logarithm of the 21-day high-low range, divided by the logarithm of 21. Jayanthi Gopalakrishnan, an editor at Technical Analysis of Stocks & Commodities.
Why logarithms — this is the only reason to learn it. The ratio of two logs is an estimate of fractal dimension: how much a line wiggles relative to how far it travels. A perfectly straight line has dimension 1. A line so jagged it nearly fills a plane approaches 2. The same maths measures coastlines.
What that means on a chart: low GAPO means price covered its range efficiently — a trend. High GAPO means it covered the same ground by thrashing — a range. It is the choppiness question again, arrived at through geometry rather than through summing true ranges.
The honest assessment, and you should hear it plainly: this is obscure for a reason. The Choppiness Index answers the same question, is bounded 0–100, has conventional thresholds, and appears in every platform. GAPO is unbounded, its level depends on the price of the instrument, and it has no standard interpretation. The idea — fractal dimension as a regime measure — is elegant and genuinely worth knowing. The indicator is a worse implementation of it than the one already on your chart.