P/E ratio (Price ÷ Earnings)
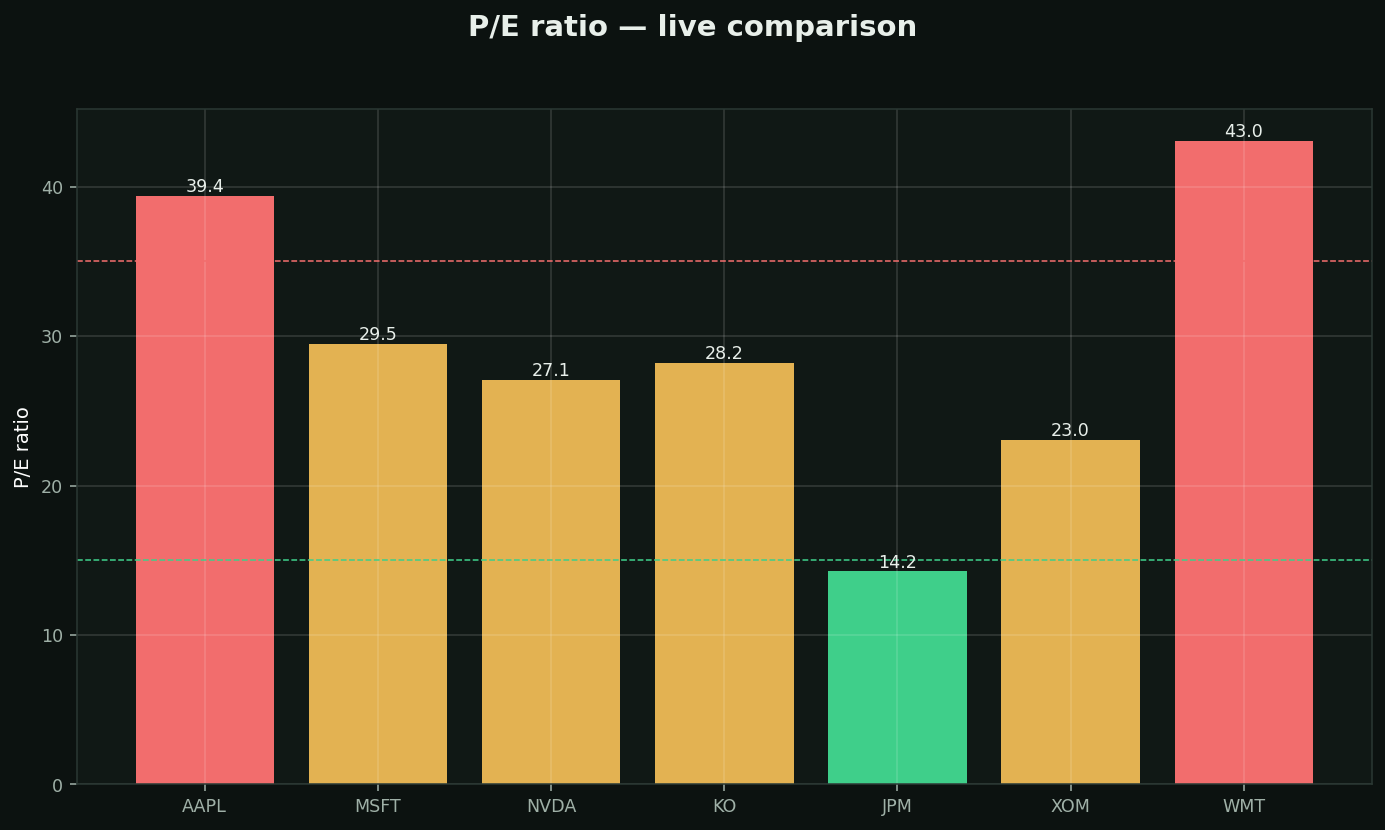
What it is: how many dollars you pay for $1 of the company's yearly profit. A P/E of 20 = you pay $20 for each $1 it earns.
Rules of thumb:
• Under ~15 = cheap (green) · 15-35 = normal · over ~35 = expensive (red)
• BUT growth changes everything — a fast grower *deserves* a higher P/E
The trap everyone falls into: a low P/E can mean "bargain" OR "the market thinks earnings are about to collapse." Cheap + shrinking business = value trap. Always ask WHY it's cheap.
How to use it: compare within an industry (banks vs banks, tech vs tech), never across. Chart shows live P/Es — notice how different "normal" is per industry.