Andrews' Pitchfork
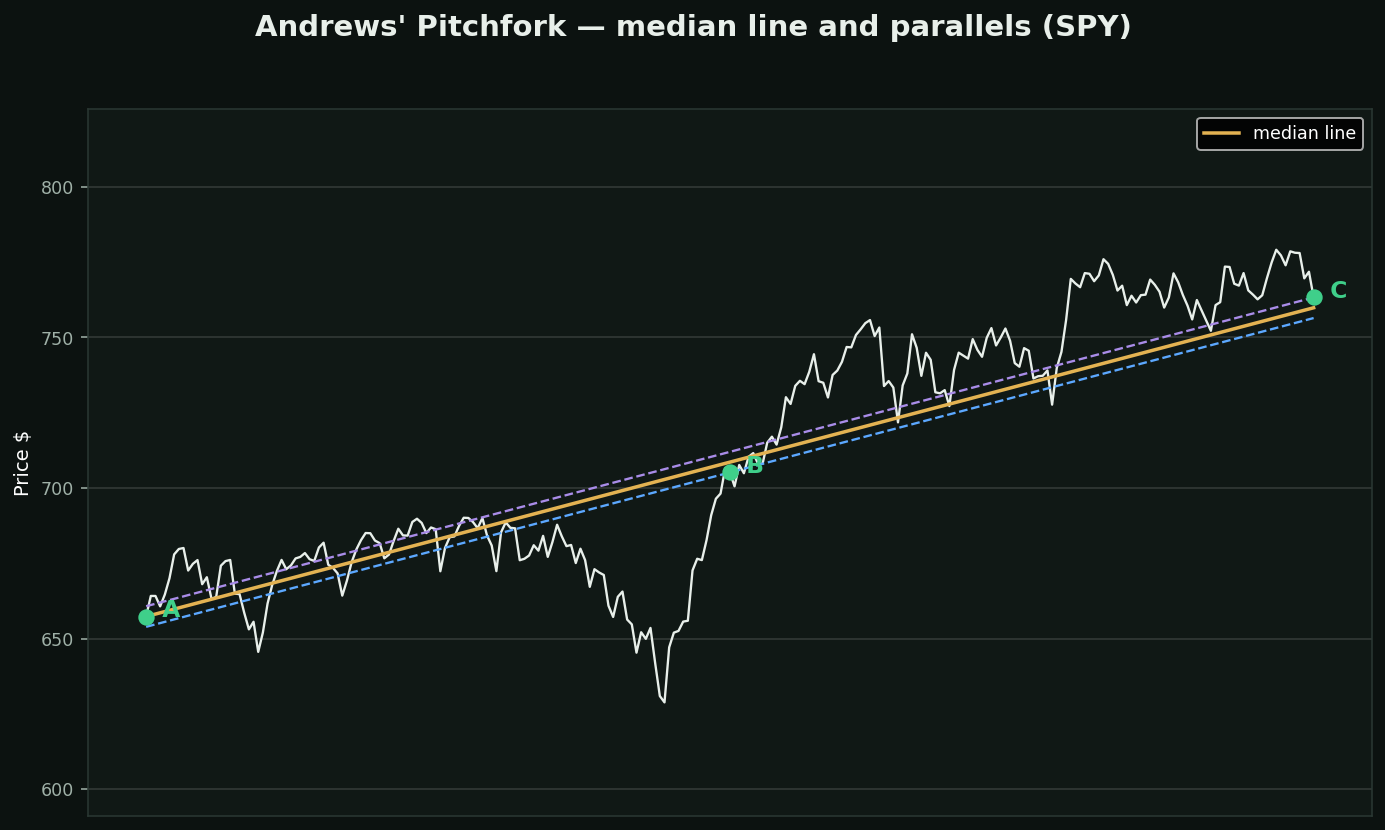
What it is: pick three pivots — A, B and C. Find the midpoint of B and C. Draw a line from A through that midpoint: the median line. Then draw parallels through B and through C. Alan Andrews, who claimed price returns to the median line about 80% of the time.
Why this one deserves more respect than most of the palette: once you have chosen the three points, everything else is arithmetic. No tolerance window, no angle, no scale dependence, nothing to fudge. Two people given the same A, B and C draw the identical pitchfork.
And the idea underneath is sound. The median line is a regression of sorts — a centre of gravity for the swing — and the parallels are a channel. It is mean reversion drawn by hand, and mean reversion is the one behaviour this toolkit's own testing keeps finding (SPY's Hurst exponent reads 0.44, below the 0.5 of a random walk).
The catch is still the anchors. Three points is one more choice than a trendline, not one fewer, and Andrews' 80% has never been reproduced under rules that fix how A, B and C get picked.
How to make it testable: define the pivot rule first — say, the last three 5% swings — and let the tool place the points.