Pivot Points
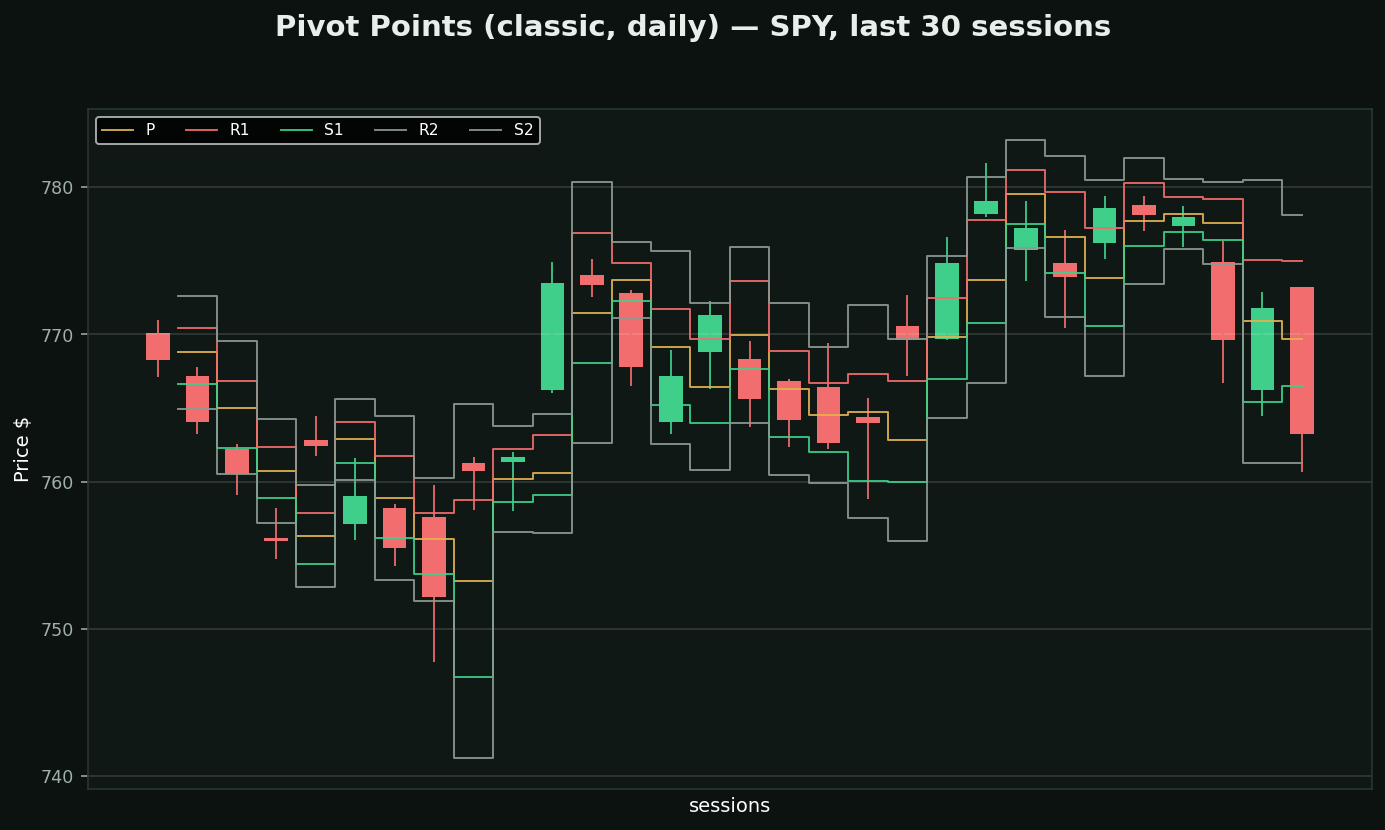
What it is: yesterday's high, low and close averaged into a single pivot (P), then support and resistance levels derived by simple arithmetic around it. Recalculated fresh every session.
Why it survives in an era of machine learning: it is completely mechanical. Floor traders used it before computers because you could work it out on paper before the open, and everyone got the SAME numbers. That is still the point — pivots matter partly because they are self-fulfilling. There is no parameter to tune and no version of it that is "yours".
How traders use it:
• Opening above P frames the day long, below frames it short
• R1/S1 are the realistic targets; R2/S2 are trend-day extensions
• The pivot itself is where intraday mean reversion aims
Honest limits: it is an INTRADAY tool. On a daily chart the levels reset before they can matter. And it knows nothing about volume — Volume Profile answers the same "where are the levels" question with evidence rather than arithmetic.