Standard deviation and the z-score
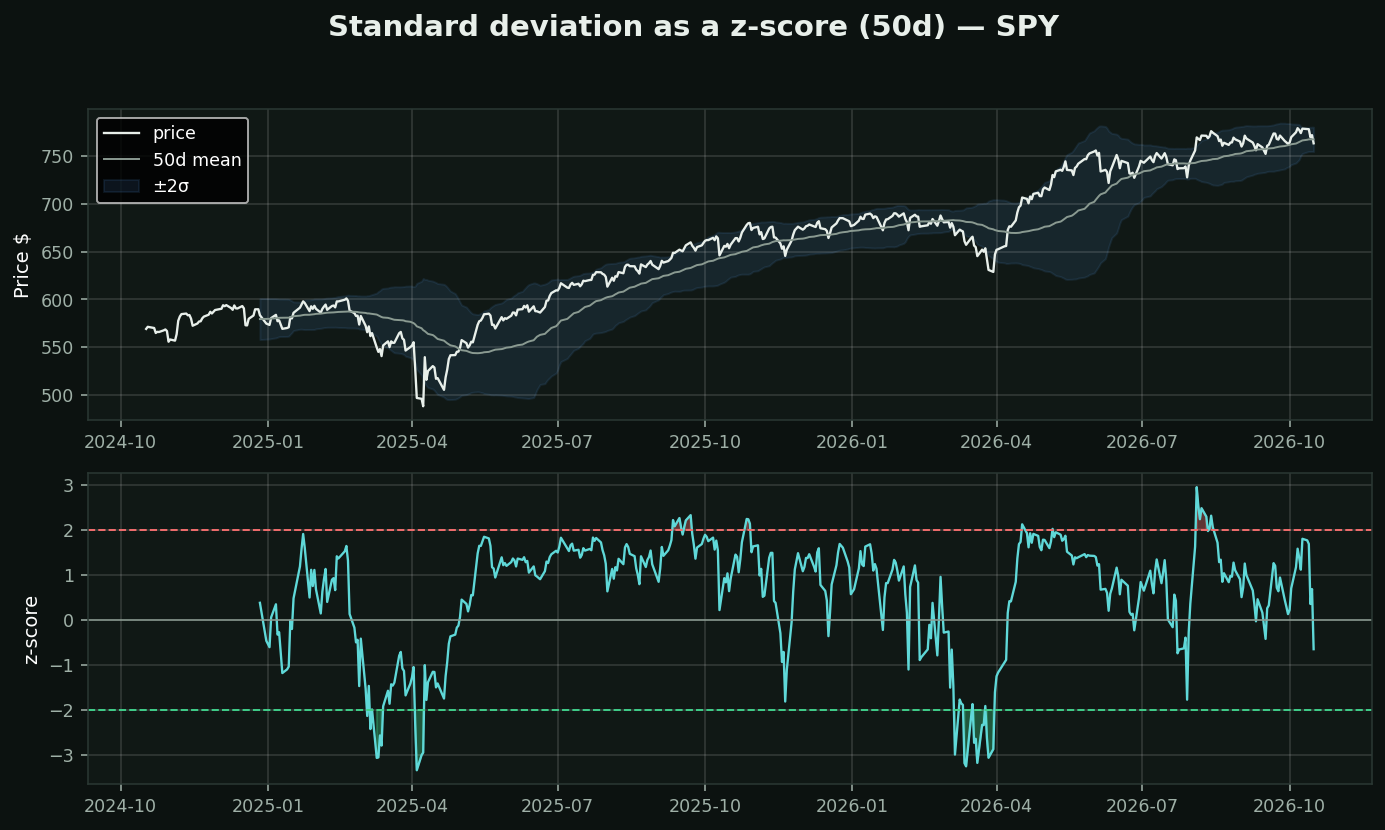
What it is: the average distance of price from its own mean. Turn it into a z-score — how many standard deviations price sits from its 50-day average — and you have a single number that is comparable across every stock, every price, every era.
Why this is the foundation, not an indicator: Bollinger Bands are the mean ±2σ. Historical volatility is σ of returns, annualised. Bandwidth is 4σ over the mean. Keltner swaps σ for ATR. Learn this one idea and five studies in that menu collapse into one.
What ±2σ actually means: if returns were normal, price would be outside ±2σ about 5% of the time. Returns are NOT normal — the tails are much fatter than the textbook — so treat 2σ as *unusual*, never as *impossible*. Every blown-up fund in history was short something that was only supposed to be a 5σ event.
How traders use it: z-scores are the standard way to compare a cross-section — rank 500 stocks by how stretched each is against its own history, rather than against each other's prices.
Chart: SPY is at -0.7σ.