Supertrend
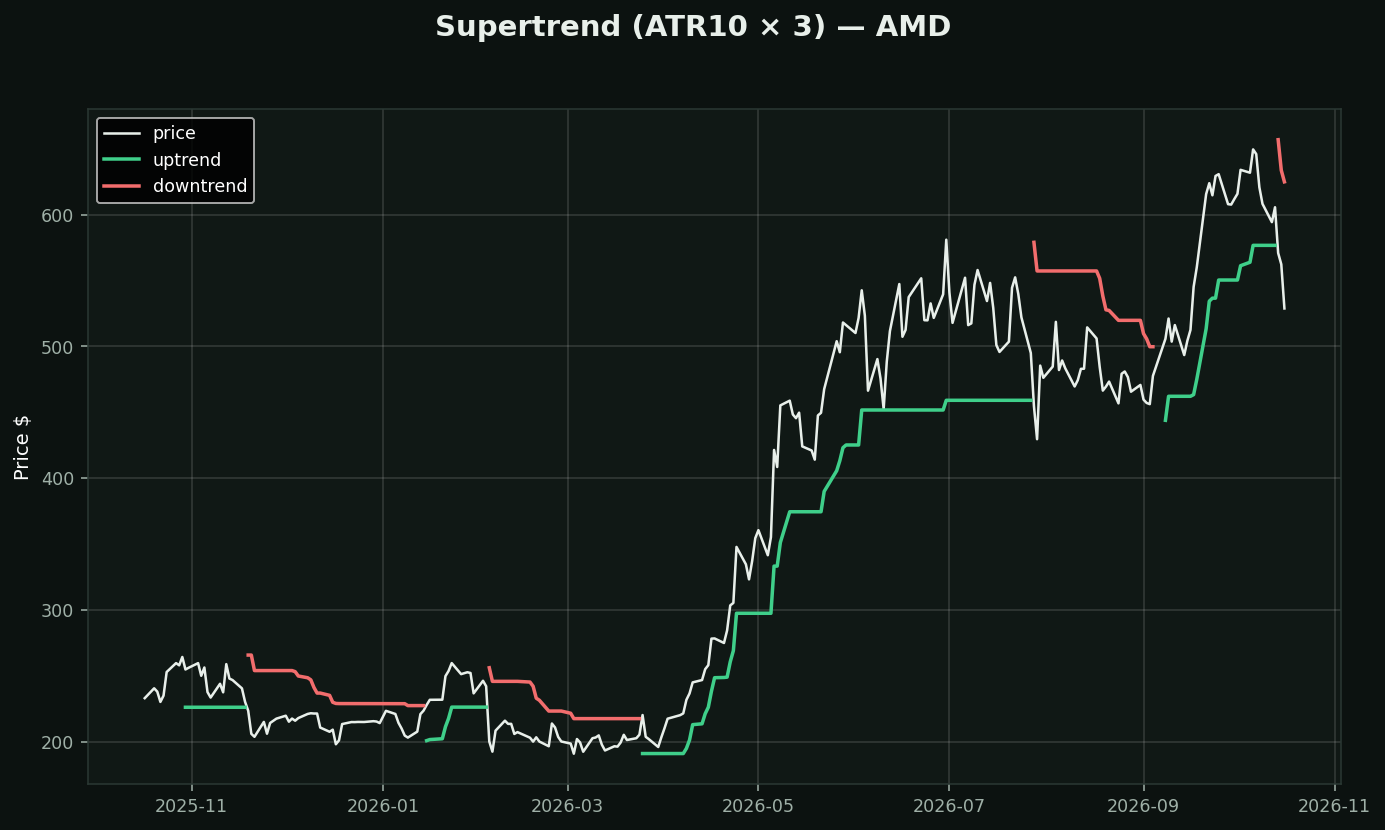
What it is: one line that sits below price in an uptrend and above it in a downtrend, placed a multiple of ATR away from the midpoint of the bar. When price closes through it, the line flips sides.
Why it caught on: it is a trailing stop that adapts to volatility automatically. A quiet stock gets a tight line, a wild one gets a wide line, and you never have to pick a percentage. It also ratchets — in an uptrend the line only moves up, never down, so profit gets locked in without discretion.
How traders use it:
• As a stop, which is what it is
• Multiplier is the whole game: 3× ATR rides long moves and gives back a lot; 1.5× exits early and whipsaws in chop
• 8 flips in a year on this chart — each one is a round trip in commissions and spread
Versus Parabolic SAR: same job. SAR accelerates toward price and exits sooner; Supertrend keeps a constant volatility distance and stays in longer. Run one.
What testing here found: this is a trend-following tool, and that family did not survive its own test. Over 413,946 stock-days, "price above its moving averages" preceded -0.46% at 21 days (t=-4.40) while downtrend preceded +1.14% (t=+6.02). Use it to describe a trend and to manage a stop — not to decide direction.