Percentage Price Oscillator
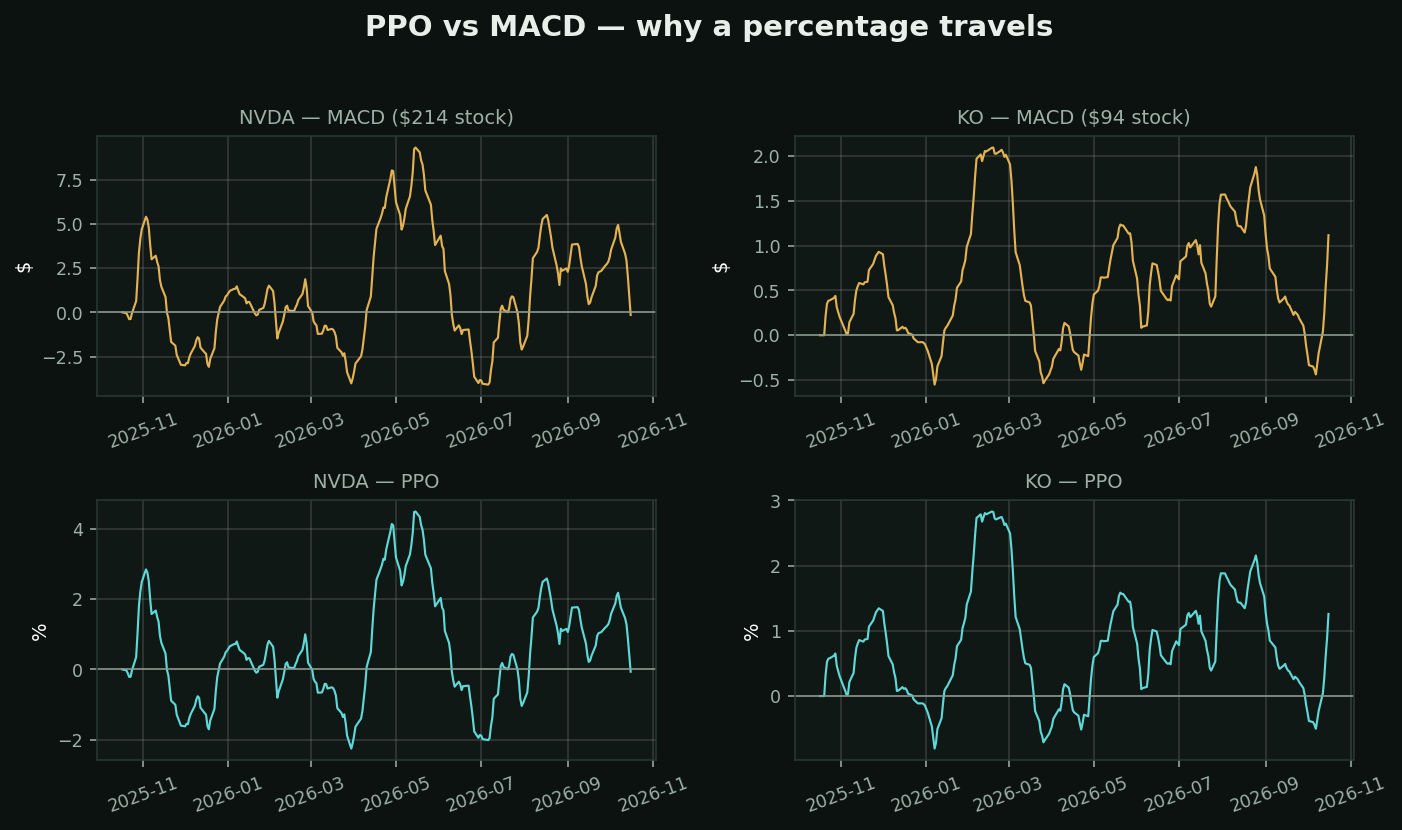
What it is: MACD divided by the slow moving average, expressed as a percent. Identical shape, different units.
Why that one change matters — look at the chart. Top row is MACD for NVDA and KO; bottom row is PPO for the same two. The MACD panels have completely different y-axes, because MACD is measured in dollars and one of these stocks costs several times the other. You cannot say "MACD above 2 is strong" and mean anything by it.
The PPO panels are directly comparable. PPO of 3 means the fast average is 3% above the slow one, in any stock, at any price, in any decade.
What this unlocks:
• Screening — rank 500 names by PPO and the ranking is meaningful. Rank them by MACD and you have mostly ranked them by share price
• History — comparing a stock's PPO today to its PPO in 2015 works. MACD's does not, if the stock has 5x'd since
• Cross-asset — an index, a $4 stock and gold on one scale
The honest summary: PPO is strictly better than MACD for anything quantitative, and MACD is more popular anyway. Popularity and merit are different axes.
What testing here found: this is a trend-following tool, and that family did not survive its own test. Over 413,946 stock-days, "price above its moving averages" preceded -0.46% at 21 days (t=-4.40) while downtrend preceded +1.14% (t=+6.02). Use it to describe a trend and to manage a stop — not to decide direction.