The volatility squeeze
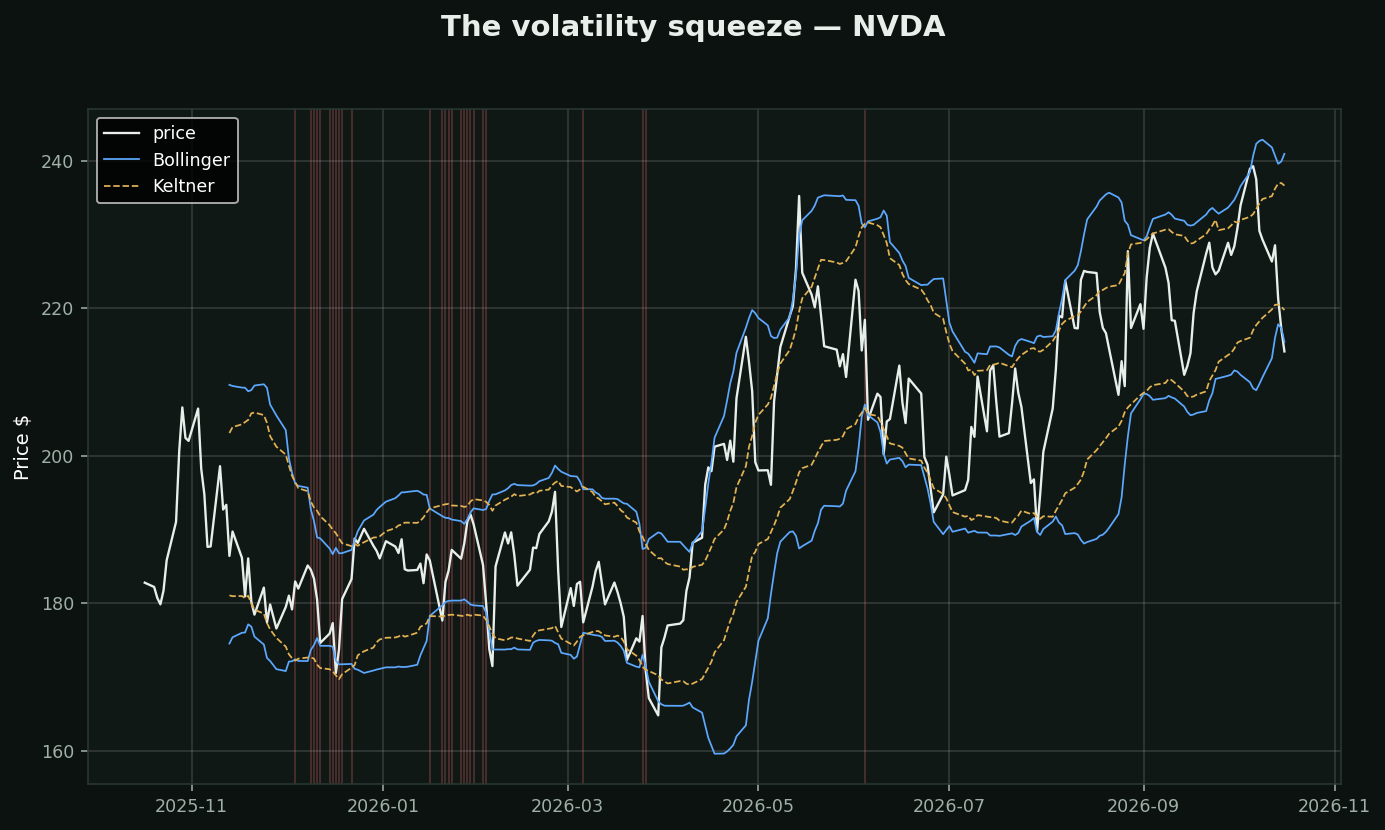
What it is: when Bollinger Bands (volatility-based) pinch INSIDE Keltner Channels (range-based) — red shading on the chart. It means volatility has compressed to unusually low levels.
Why it matters: volatility is cyclical — quiet periods are not stable, they're LOADING. The market's spring is being compressed, and squeezes resolve in explosive moves far more often than chance.
How traders use it:
• The squeeze itself says a big move is COMING, not which way
• Direction comes from the breakout — trade the side it fires
• Options are cheapest exactly during squeezes (low IV) — buyers' moment