Volume
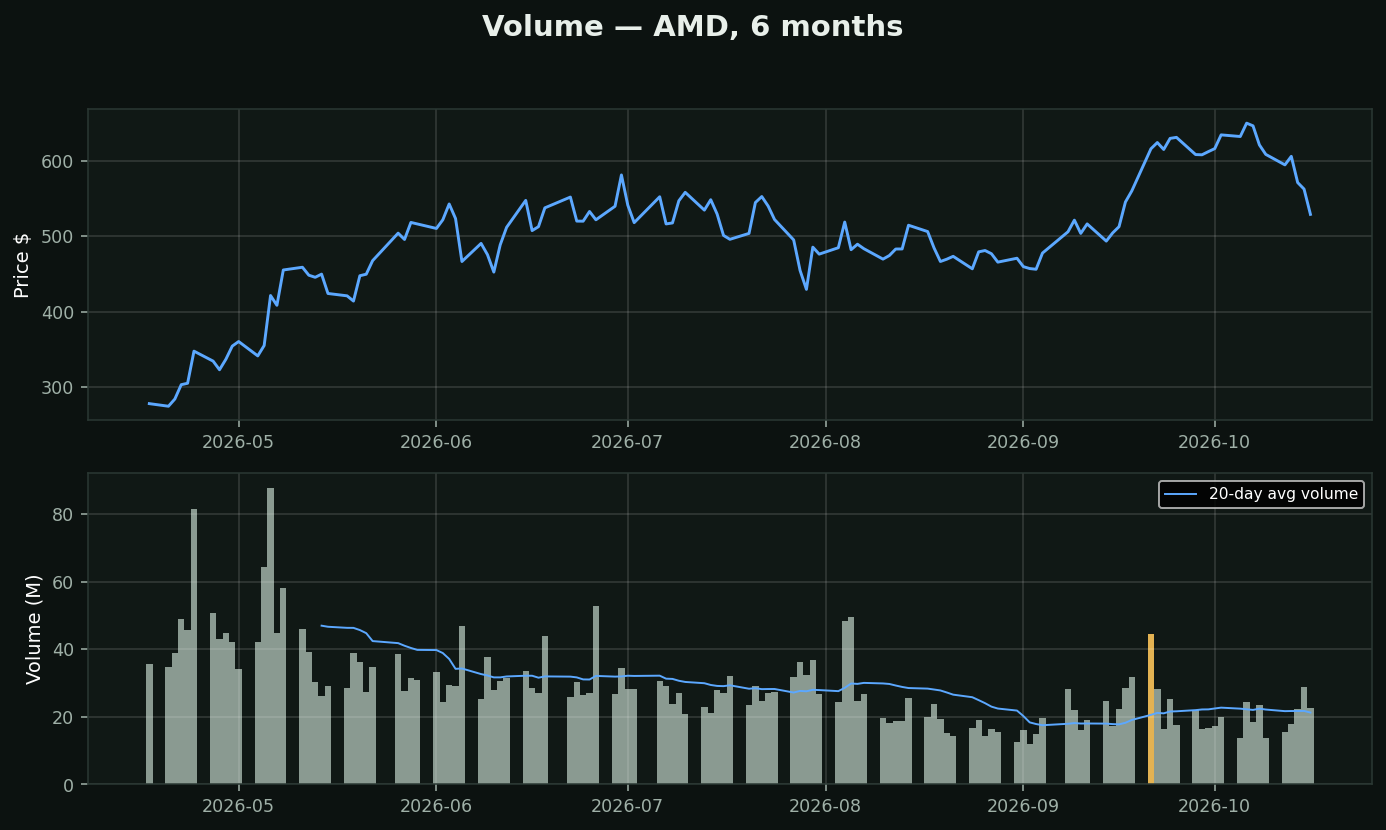
What it is: how many shares actually traded. Price says *what* happened; volume says *how much conviction* was behind it.
How to read it:
• Breakout on HUGE volume (2x+ average — amber bars) = real, institutions participating
• Breakout on thin volume = suspect, often fails
• Massive volume after a long decline = capitulation — everyone who was going to sell just did
How traders use it: as the lie detector for price moves. Any signal from any other indicator is stronger when volume confirms it.
Chart: AMD — amber bars mark 2x+ volume days. Check what price did next.