TRIX
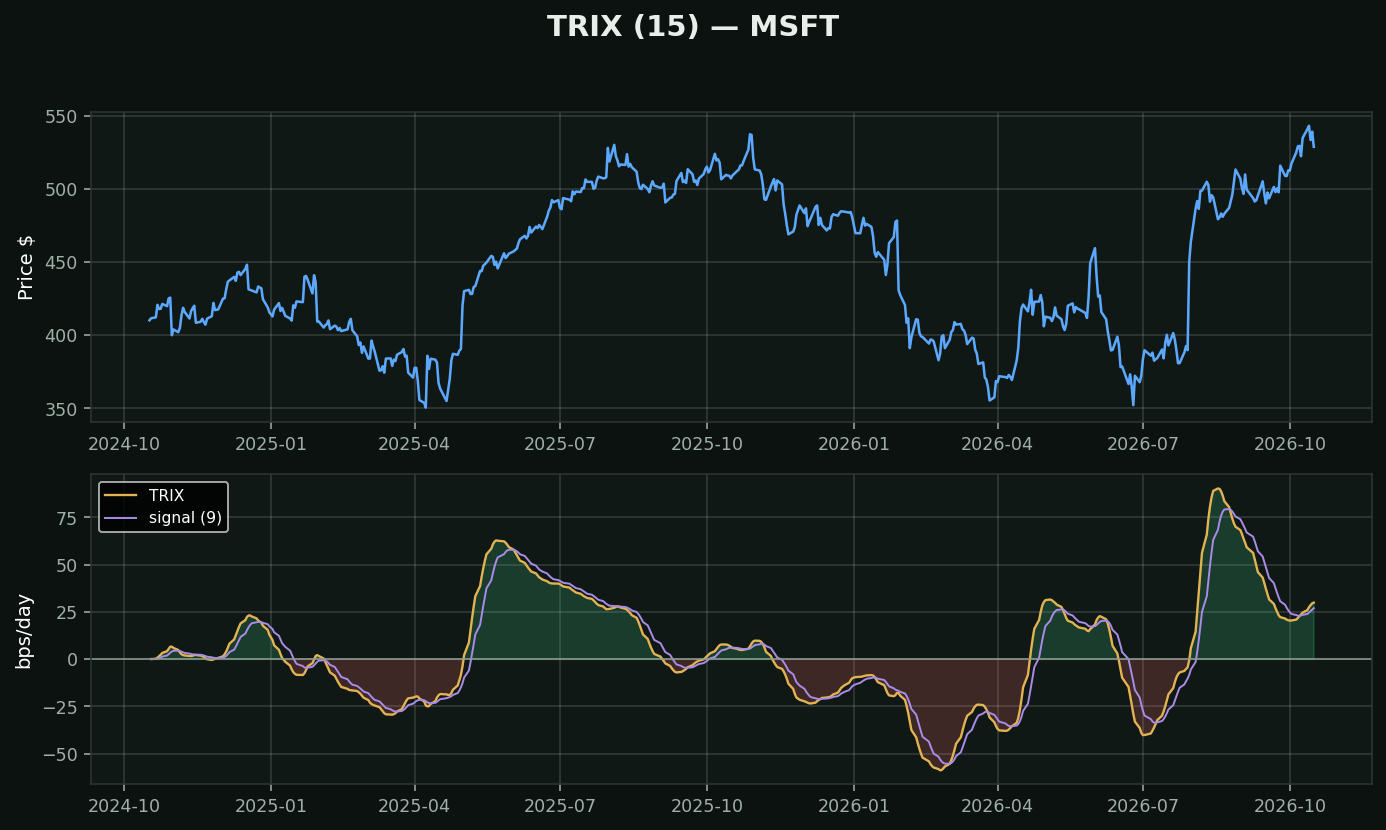
What it is: take an exponential average of price. Take an exponential average of THAT. Then a third. Now plot the daily rate of change of the result. Jack Hutson, 1980s.
Why three times: each smoothing pass strips out cycles shorter than the span. Three passes removes essentially all of the short-term noise, so TRIX crosses zero far less often than MACD does. On a choppy chart where MACD whipsaws a dozen times, TRIX may cross twice.
What you pay for it: lag, and a lot of it. Triple smoothing means TRIX turns well after the price does. It is not an entry tool and nobody serious claims it is.
How traders use it:
• Zero-line crossings as a slow regime marker — is the medium-term drift up or down
• Divergence against price, which is where it earns its keep: because it is so smooth, a TRIX divergence is rarely noise
• The signal-line cross is the faster, noisier version of the same read
Family: MACD, PPO and TRIX are the same construction at different smoothing depths. Pick one.
What testing here found: this is a trend-following tool, and that family did not survive its own test. Over 413,946 stock-days, "price above its moving averages" preceded -0.46% at 21 days (t=-4.40) while downtrend preceded +1.14% (t=+6.02). Use it to describe a trend and to manage a stop — not to decide direction.