True Range
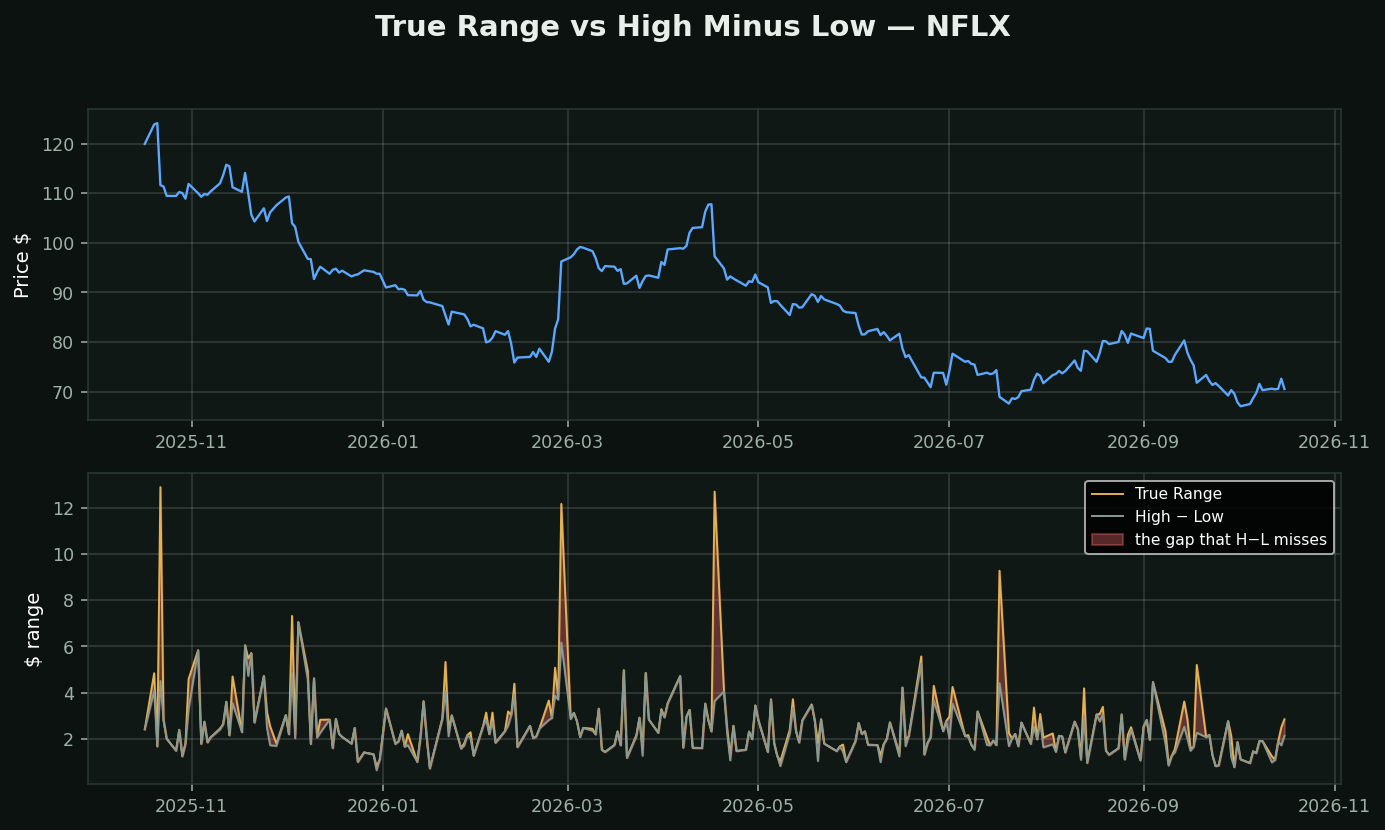
Two studies, one letter apart. *High Minus Low* is today's high minus today's low. *True Range* is the largest of three: today's high−low, |today's high − yesterday's close|, and |today's low − yesterday's close|. Welles Wilder, 1978.
Why the extra two terms exist: because a stock that closes at $100 and opens at $88 has moved $12, and high−low says it moved whatever it did after the open. The gap is the part of the move that happened while you could not trade — which is the part that actually hurt you.
On this chart the red fill is what plain high−low misses. It happens on 30% of days and understates the year's total movement by 10%. The single worst day was understated by $9.05.
Why this is worth a whole lesson: true range is the input to ATR, Keltner, Supertrend, ADX, choppiness and half the study library. If you understand why Wilder added the gap terms, you understand what every one of those is measuring. Any volatility study built on plain high−low systematically under-reads risk on exactly the days risk shows up.
Practical use: stop distance and position size. A stop inside one ATR is a stop that gets hit by ordinary noise.