The Ulcer Index
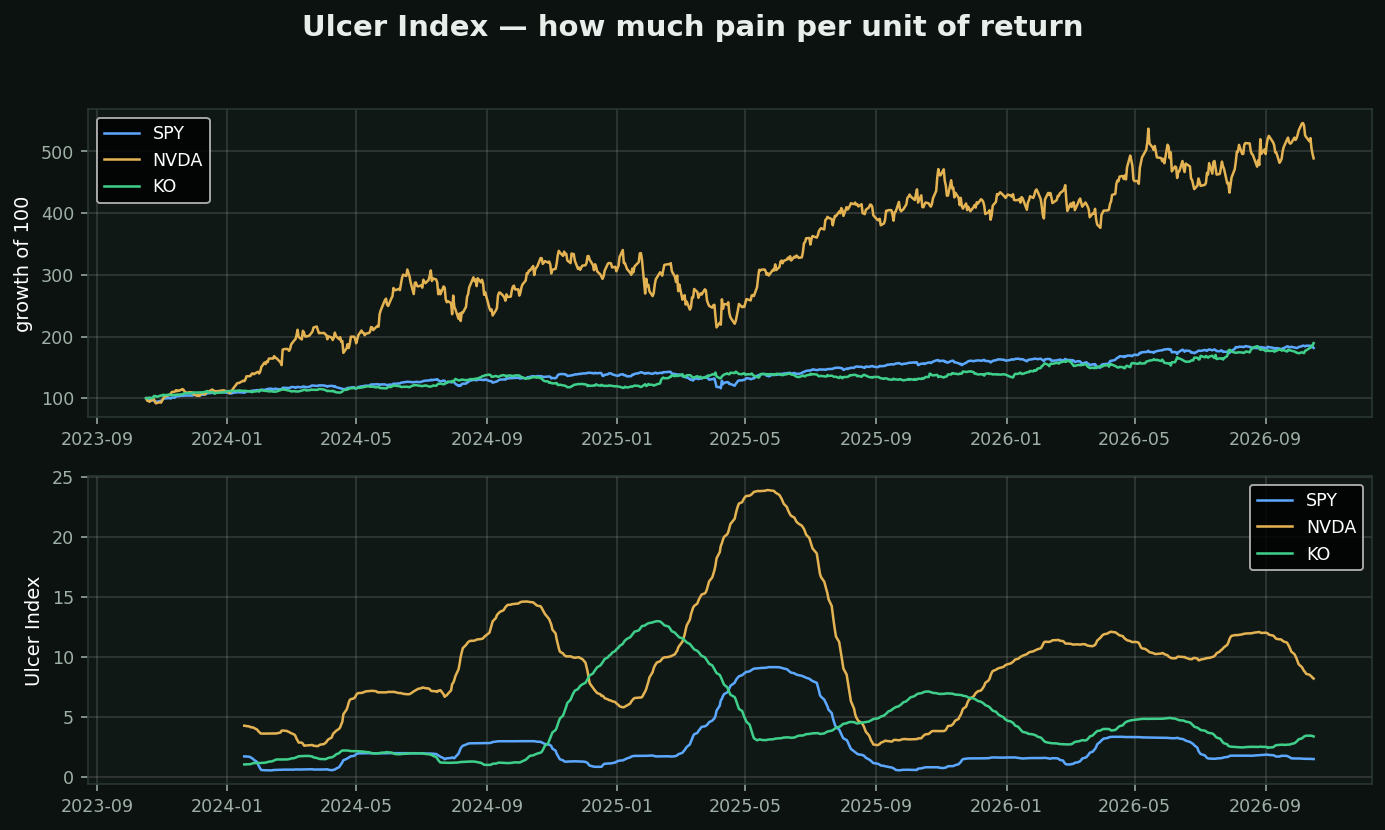
What it is: the root-mean-square of how far below its own high water mark a stock has been. Named for what it measures — how much it hurt to hold.
Why not just use volatility: standard deviation punishes upside and downside equally. A stock that gaps +15% and a stock that gaps -15% score the same, which is absurd — nobody has ever sold in a panic because their position went up. The Ulcer Index only counts drawdown, and it squares it, so one long -40% hole scores far worse than several brief -8% dips.
How to use it:
• Compare two holdings that returned the same amount — the lower Ulcer is the one you would have actually held to the end
• Rising Ulcer while price is flat = the drawdowns are getting longer, not just deeper
• It is a position-sizing input, not an entry signal
Chart: three years, same starting capital.
• SPY — Ulcer 1.5, worst drawdown -19%
• NVDA — Ulcer 8.2, worst drawdown -37%
• KO — Ulcer 3.4, worst drawdown -16%
The best strategy is the one you can stay in. This measures that.